Methane or Hydrogen? What the evidence currently tells us — and what it doesn’t.

Full technical paper now published: Fugitive Emissions, Cryogenic Losses and Infrastructure Trade-offs in Hydrogen and Methane Aviation Pathways — the register-governed HyFlux LCA v5.0 publication report (v3), with methods, verification, correction history and all six figures. Independent validation study: CASCADE parity & Cirium-calibrated validity (five-airport measured day; decision-grade status stated).
1 · Executive verdict
For electricity-derived fuels, grid carbon intensity is usually the dominant lifecycle-emissions lever. For methane, upstream leakage and methane slip can reverse the result. For liquid hydrogen, boil-off and vapour loss matter, but their impact depends strongly on storage, recovery and airport architecture.
Our modelling therefore identifies engineering thresholds rather than a universal winning fuel.
Grid carbon intensity dominates broad electrofuel lifecycle sensitivity within the tested parameter ranges (Sobol ST 0.901 of 1.0).[18]
Low-leakage methane can remain competitive, but the result deteriorates rapidly as full-chain methane leakage rises (break-even 0.9–1.4 % on GWP20, 2.6–3.8 % on GWP100).[9]
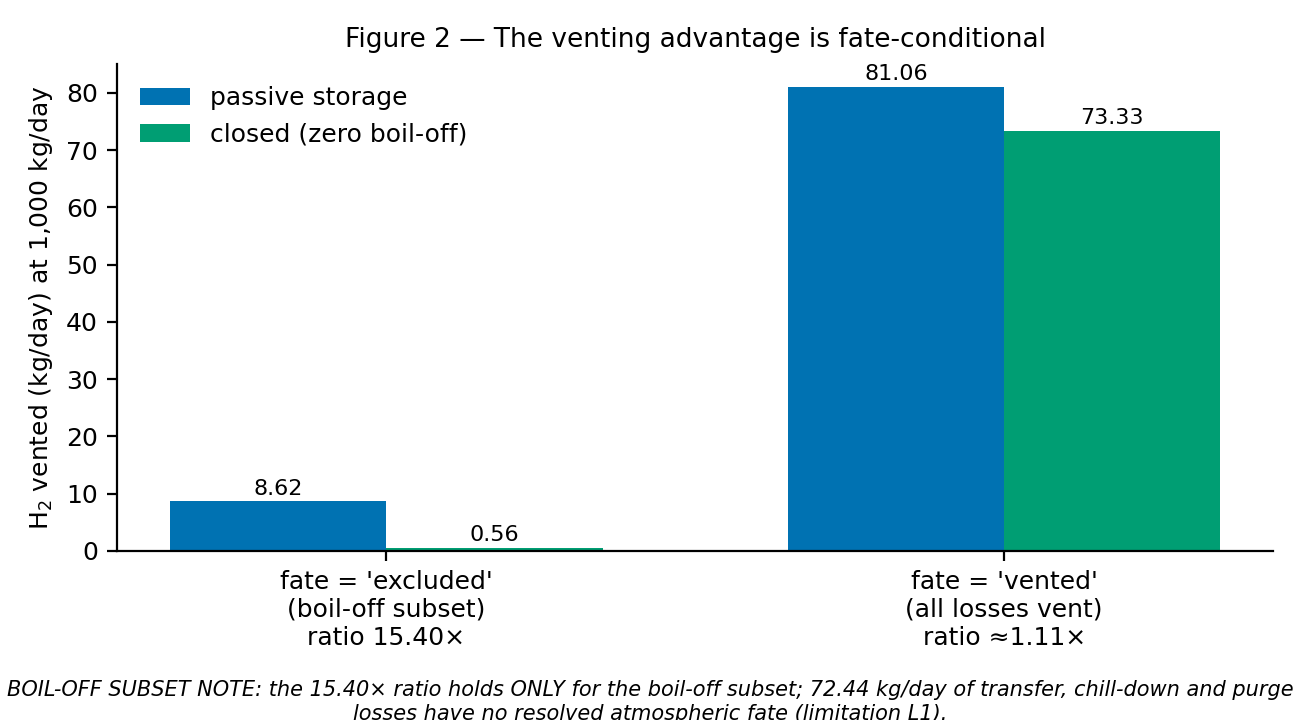
Liquid-hydrogen boil-off is an engineering and infrastructure challenge, not a universal fixed loss percentage (0.048 %/day measured on large storage). Within the modelled storage and pressure-management boundary, closed architectures reduce accounted venting from 8.62 to 0.56 kg/day (15.4×, boil-off subset).[14,16]
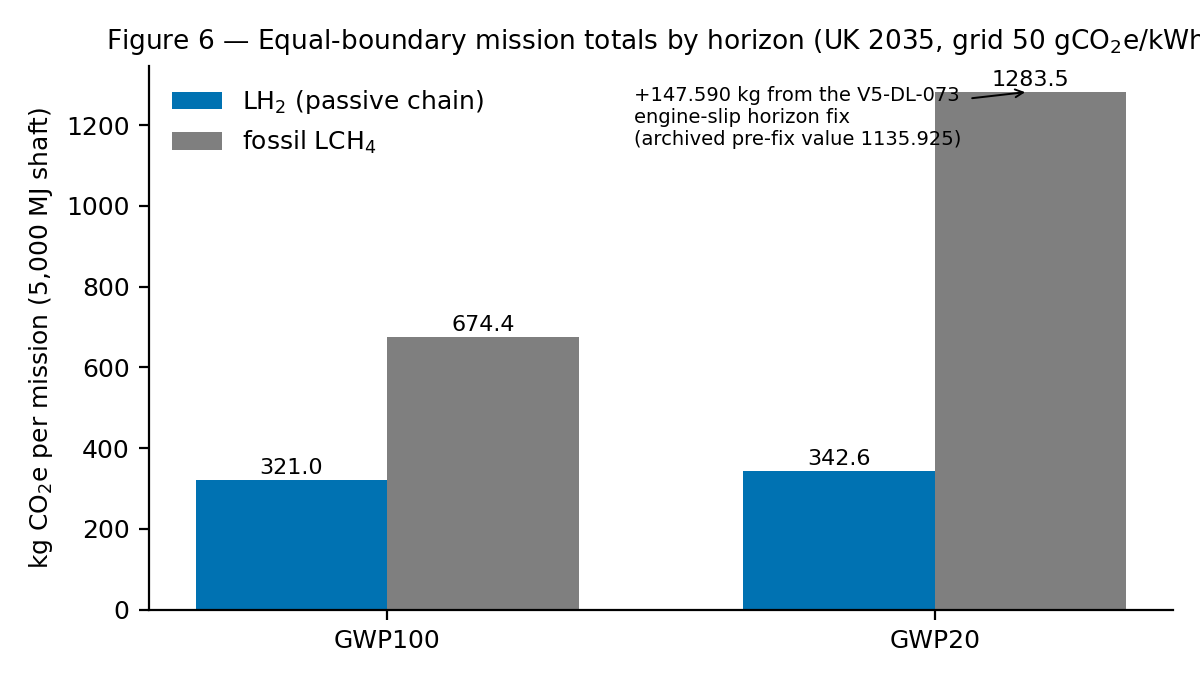
The fate of transfer, chill-down and purge losses (72.4 kg/day model-derived at 1,000 kg/day throughput — aggregating transfer, chill-down and purge; NOT a measured airport-chain rate; the majority of chain losses) is unmeasured and could dominate the full-chain result; if all are assumed vented, total atmospheric loss becomes 81.06 versus 73.33 kg/day (≈1.11×). This is the single most valuable measurement aviation hydrogen could commission.
Reliable aviation-specific measurements for aircraft-tank LH₂ losses, airport LNG operations and aircraft methane slip remain limited.
Executive conclusion
What we know (measured): methane supply-chain losses are measured and span 0.19–9.4 % by basin, with certified-low supply at 0.2 %; large stationary LH₂ storage boil-off is measured at 0.048–0.1 %/day; both gases are potent greenhouse gases when released unburned.
What modelling shows (engineering calculation): electricity carbon intensity dominates both fuel chains — more than either fuel's release behaviour within the tested domain; liquid methane holds a volumetric-range advantage; hydrogen offers zero in-flight carbon with heavier infrastructure demands.
What remains uncertain (measurement gaps): no representative airport hydrogen chain has ever been measured; the fate of transfer, chill-down and purge releases (model-derived 72.4 kg/day at 1,000 kg/day throughput) is unmeasured and is the dominant hydrogen uncertainty; hydrogen's atmospheric chemistry remains under active research.
What HyFlux recommends (research priorities): commission airport-chain release measurements (transfer fate first); require measured, independently verified leakage for any methane pathway; hold both options open — the answer is evidence-dependent, not ideological.
Mechanism-model result (new): accounting for recovery and fate mechanism-by-mechanism, central atmospheric hydrogen release is 11.1 kg/day per 1,000 kg/day delivered versus 20.0 under the legacy aggregate assumption, with 1.5 kg/day of unresolved fate held visible. The dominant release mechanism by uncertainty is transfer & chill-down (most reducible by measurement — the top research priority); the boil-off conclusion is unchanged (not supported within the tested domain); break-even findings are unchanged in structure — grid carbon intensity still dominates.
HyFlux and Boeing CASCADE broadly agree on the dominant role of electricity carbon intensity. HyFlux extends the comparison through explicit leakage trajectories, cryogenic release mechanisms and evidence traceability (see Engineering Discussion).
Engineering readiness ████████░░ Evidence maturity ███████░░░ Technology maturity ████░░░░░░ Validation ██████░░░░ Decision readiness ██████░░░░ detailed assessment →
Engineering Discussion — methodology, evidence and sensitivity (sections 2–9)
2 · The comparison boundary
Every comparison on this page uses identical boundaries wherever possible: production → conversion or liquefaction → transport → airport storage → refuelling → aircraft storage → propulsion → useful aircraft output. Results are reported separately as:
- gCO₂e/MJ fuel delivered (well-to-tank),
- gCO₂e/MJ shaft (well-to-shaft),
- kgCO₂e/mission,
- gCO₂e/ASK and gCO₂e/RPK (aircraft-level).
These measures are never mixed within a chart. LHV is used throughout (the HHV/LHV trap, up to 18 % on hydrogen, is documented in our evidence review[17]).
3 · Methane leakage evidence
Methane is a direct greenhouse gas, and leakage is a measured quantity — not an assumption. Across measurement campaigns the spread is >40×; no single figure is representative, so the bars are labelled by evidence class (regional names live in the citations).[1–7]
Units: % of gross production · Boundary: upstream oil-and-gas · Years: 2015–2023 campaigns · Status: measured / published (satellite + aircraft synthesis)
Table fallback — measured leakage evidence
| Evidence class | Value | Method | Citation |
|---|---|---|---|
| Low measured case A | 0.19 % | ship/aircraft plume | [2] |
| Low measured case B | ≤0.2 % | satellite inversion | [5] |
| Central evidence case | 2.3 % | facility + aircraft synthesis | [1] |
| Measured bio-chain case | 3.7 % | mobile plume surveys | [6] |
| Satellite basin case | 3.7 % | satellite inversion | [3] |
| High measured case | 9.4 % | airborne hyperspectral | [4] |
- Biomethane is not climate-neutral when it leaks — the renewable carbon credit applies only to the combusted fraction; a leaked kilogram forces at full GWP regardless of origin (proof implemented and test-locked).[9]
- GWP20 weighs leakage far more than GWP100 (80.0 vs 29.8, AR6 origin-neutral class values) — short-horizon analysis is where methane's case collapses first.[8]
- Super-emitters are intermittent and heavy-tailed (8–12 % of global O&G methane[7]), so distributions must be heavy-tailed, not purely average — our chain model samples them with a Pareto tail.[16]
4 · Climate potency comparison
Two different physics, two different horizons — kept as separate bars, never one opaque "leakage penalty". Methane warms directly; hydrogen warms indirectly through atmospheric chemistry (OH depletion → methane lifetime, tropospheric ozone, stratospheric water vapour).[10–13]
Units: kgCO₂e/kg · Boundary: atmosphere · GWP20 and GWP100 shown separately · Status: published (IPCC AR6 origin-neutral CH₄ class values; model-ensemble H₂ with uncertainty)
Table fallback — climate potency
| Species | Horizon | Central | Uncertainty | Mechanism | Citation |
|---|---|---|---|---|---|
| CH₄ | GWP20 | 80.0 | AR6 origin-neutral class | direct GHG | [8] |
| CH₄ | GWP100 | 29.8 | AR6 origin-neutral class | direct GHG | [8] |
| H₂ | GWP20 | 37.3 | ±15.1 | indirect chemistry | [10] |
| H₂ | GWP100 | 11.6 | ±2.8 | indirect chemistry | [10–13] |
| H₂ | GWP100 | 8.0–12.8 | model spread | indirect chemistry | [12,13] |
Basis note: this page previously printed 29.88 / 82.5 — 82.5 is the AR6 fossil-specific value; the values above are the IPCC AR6 origin-neutral class values (29.8 / 80.0) and the ≈3 % difference is a declared basis choice, documented in the model.
Evidence-dependentHydrogen vapour is not climate-neutral — it belongs in the carbon-intensity formula, where both Boeing CASCADE and our engine carry it. At real chain losses (§5) it is a small, declared ledger line; the binding risk is near-term erosion and blue-hydrogen's upstream methane, not break-even. Atmospheric warming from replacement-fuel production is always reported separately from these potency figures.
5 · Liquid-hydrogen boil-off and infrastructure
Vapour generated is not automatically hydrogen vented. Boil-off gas has five separate destinations — recovered, consumed, returned to stock, re-liquefied, vented — and only the last is an emission. Large stationary storage loses 0.048–0.1 %/day measured;[14] zero-boil-off storage is demonstrated at 125,000 L with a 390 W cooler at 20 K (TRL 6);[15] onboard active cooling is TRL 1 — you engineer the ground chain, not the aircraft.[14]
Units: kg/day · Boundary: 13-stage airport chain, 1,000 kg/day throughput · boil-off subset — fate of transfer, chill-down and purge losses excluded and declared · Scenario set: HyFlux v5 · Status: modelled (stage rates from [14,17]; aircraft-tank rate = scenario parameter, no public measurement)
Table fallback — scenario venting (with model assumptions)
| Scenario | Vented kg/day | Vapour destinations |
|---|---|---|
| passive / vented storage | 8.62 | all vapour emitted |
| partial active cooling | 4.60 | 50 % re-liquefied |
| boil-off use | 3.78 | 60 % consumed as energy |
| vapour return | 2.98 | 70 % recovered to plant |
| ZBO / re-liquefy / hub / accumulate | 0.56 | closed; transfer-stage flash only |
Model assumptions (required for these numbers): 1,000 kg/day throughput; tanks at 85 % fill; stage residence 1–48 h; ambient 288 K; storage-stage boil-off rates 0.048–0.5 %/day by stage class; re-liquefaction charged at 10 kWh/kg; recovery returns to the plant, re-liquefaction returns to stock. Different assumptions → different numbers; Model assumptions, evidence classifications, selected equations and published outputs are publicly documented; the source code is privately maintained and governed by automated regression tests.[16]
Within the modelled storage and pressure-management boundary, closed architectures reduce accounted venting from 8.62 to 0.56 kg/day (15.4×, boil-off subset). Unresolved transfer, chill-down and purge losses (model-derived 72.4 kg/day @1 t/day; not a measured airport-chain rate) could dominate the full-chain result; if all are assumed vented, total atmospheric loss becomes 81.06 versus 73.33 kg/day (≈1.11×) — the fate of those losses is the UNKNOWN flagged in §1 and §11.
Not supported within the tested domain"Boil-off is hydrogen's Achilles heel" — tested domain: grid CI 0–400 gCO₂e/kWh; storage boil-off 0.048–0.5 %/day by stage class; 1,000 kg/day throughput; bowser-chain architecture; transfer-loss fate assumed recovered in the central case (UNMEASURED); per-MJ-delivered functional unit; GWP₁₀₀ (GWP₂₀ reported separately). Within that domain it is fatal only under one architecture (long-dwell, low-throughput, passive storage with no recovery). The dominant LH₂ penalty is liquefaction electricity: 10–13 kWh/kg in actual plants[17] — an energy input, distinct from boil-off, and ~30× LNG's 0.25–0.35 kWh/kg, which is a genuine infrastructure advantage for methane, on the record.[17]
6 · Equal-boundary break-even map
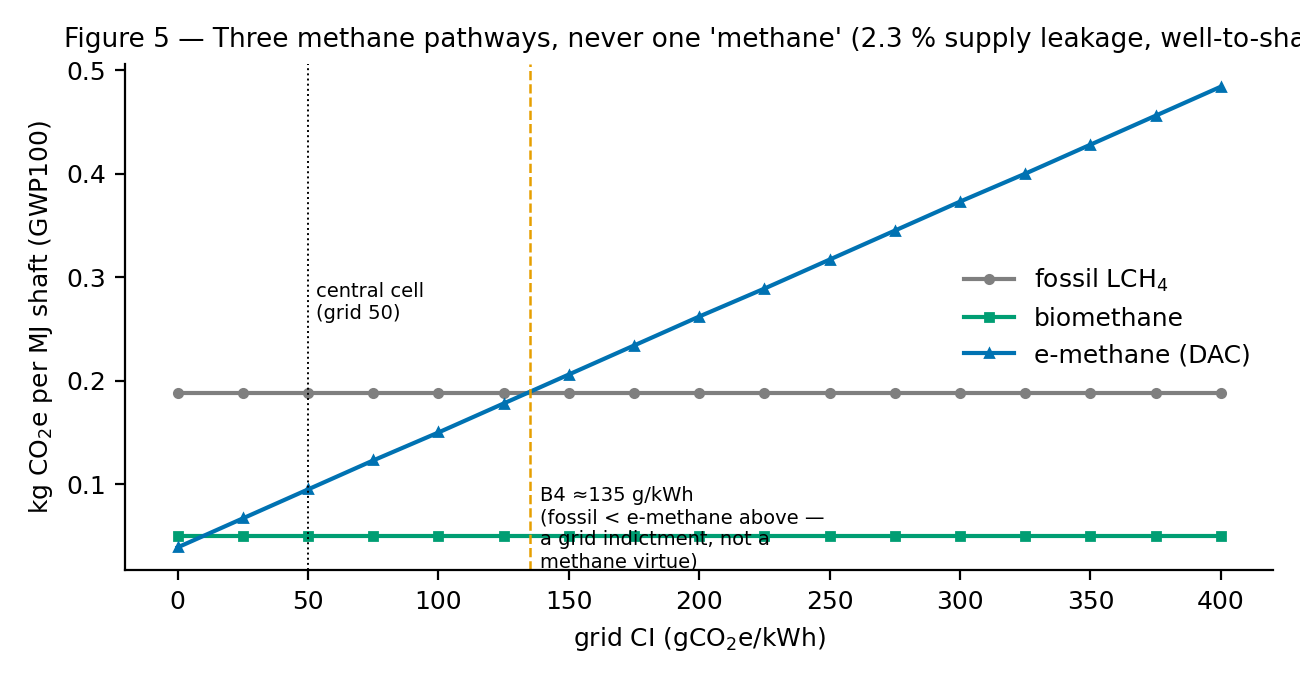
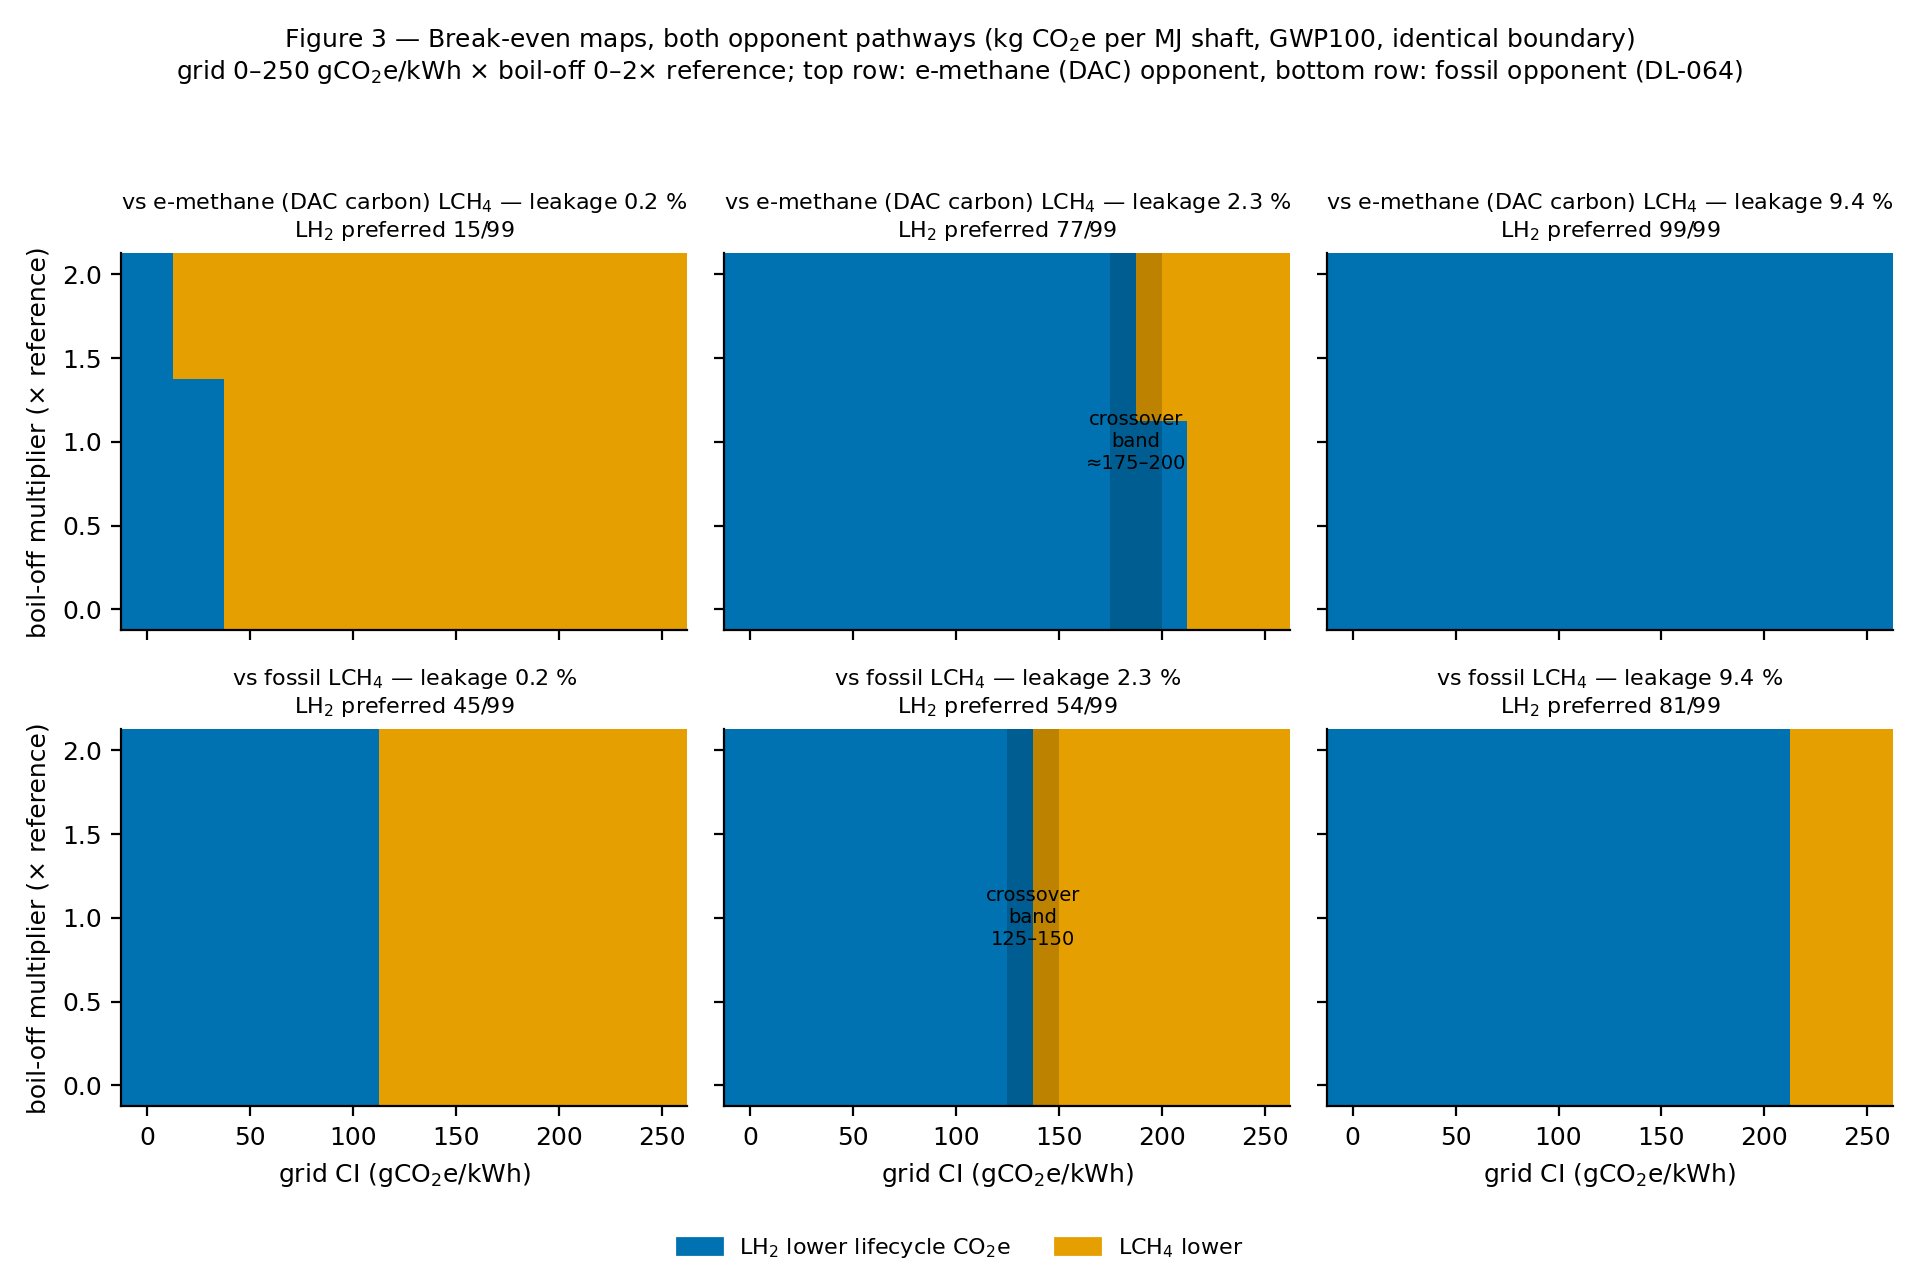
The central chart. Preferred pathway (lower lifecycle CO₂e per MJ shaft) across electricity carbon intensity (x) and LH₂ loss scenario (y), with the three methane pathways kept distinct — e-methane, biomethane and fossil methane are never one generic "methane". The map's default opponent is e-methane (DAC-carbon) LCH₄ — opponent relabelled per DL-064; values unchanged. The leakage-class rows below are measured fossil-supply classes applied as scenario parameters; the fossil-LCH₄ opponent is tabulated separately.
Units: x = grid gCO₂e/kWh (0–250), y = LH₂ boil-off generated (0–2×) · Boundary: identical, well-to-shaft · Scenario: leakage 2.3 %, recovery 0, η_eng 0.5 · Status: modelled (HyFlux v5 break-even engine)
Refinement, 26 July 2026 — the boundary is a surface, not a threshold.
A second, independent ledger was built to compare the two pathways on a well-to-tank boundary (1 MJ LHV delivered into the aircraft tank), with the same grid carbon intensity applied to every electrical input on both sides and the GWP horizon stated explicitly. It is a different boundary from the well-to-shaft map above and does not replace it — the two answer different questions and their numbers are not interchangeable.
On that boundary, the hydrogen chain-loss value at which LH₂ and e-methane draw level is not a single number. Across the plausible parameter space it spans roughly 3.6–20.6 % cumulative hydrogen chain loss. Ranked by how far each input moves that boundary, at grid CI 50 gCO₂e/MJ on GWP₁₀₀:
| Input | Range tested | Boundary moves by |
|---|---|---|
| Methane leakage | 0.5 → 9.4 % | 23.5 points |
| H₂ liquefaction specific energy | 15 → 4.8 kWh/kg | 7.4 points |
| DAC energy | 0.15 → 0.40 MJ/MJ | 5.4 points |
| Grid carbon intensity | 0 → 400 gCO₂e/MJ | 4.8 points |
| GWP horizon | GWP₁₀₀ → GWP₂₀ | 2.5 points |
Methane leakage is the largest single mover of the pathway decision on this boundary — larger than any hydrogen-side parameter, and larger than grid carbon intensity. That is consistent with §3 and §8 but sharpens them: the earlier work held leakage fixed at a central value and therefore could not see its rank. A second correction to our own prior framing: liquefaction efficiency is the second-largest mover, not the negligible one an earlier internal draft concluded — that draft had swept grid CI only and generalised from it.
Status: modelled — conceptual, not validated. Conditional on an engineering-estimate value for hydrogen transfer and chill-down loss, which remains the governing measurement gap (§11). Reported as a conditioned range rather than a single threshold, deliberately.
Table fallback — computed cell outcomes vs e-methane (DAC-carbon) LCH₄ (opponent relabelled per DL-064; values unchanged)
| Supply leakage (measured fossil-supply class, applied as parameter) | LH₂ wins (of 99 cells) | e-methane LCH₄ wins | Reading |
|---|---|---|---|
| 0.2 % (certified-low supply class) | 15 / 99 | 84 / 99 | low-leak e-methane LCH₄ leads most of the map — the certification regime, not the molecule, does the work |
| 2.3 % (US-average supply class) | 77 / 99 | 22 / 99 | LH₂ leads below ≈175–200 g/kWh; e-methane LCH₄ keeps only the dirty-grid corner (grid ≥ 225, plus grid 200 at boil-off ≥ 1.25×) |
| 9.4 % (worst-basin supply class) | 99 / 99 | 0 / 99 | e-methane LCH₄ leads nowhere |
Table — computed cell outcomes vs the fossil LCH₄ opponent (same boundary and leakage classes; register CR-V5-036/037)
| Supply leakage | LH₂ wins (of 99 cells) | Fossil LCH₄ wins | Reading |
|---|---|---|---|
| 0.2 % (certified-low supply class) | 45 / 99 | 54 / 99 | fossil's combustion CO₂ is a grid-independent floor — LH₂ takes far more low-leakage cells than against e-methane |
| 2.3 % (US-average supply class) | 54 / 99 | 45 / 99 | clean crossover at 125–150 g/kWh — a clean column transition, no boil-off dependence |
| 9.4 % (worst-basin supply class) | 81 / 99 | 18 / 99 | fossil LCH₄ keeps only the dirtiest-grid columns |
Physically, the two opponents differ because fossil methane carries its combustion CO₂ everywhere on the map, while e-methane carries synthesis electricity that scales with grid CI — so LH₂ beats fossil LCH₄ in more low-leakage cells but beats e-methane LCH₄ in more dirty-grid cells.
A previously published crossover figure roughly an order of magnitude lower was recomputed and formally withdrawn (claims register; a regression test guards against its return).
EstimatedFossil methane beats e-methane only on carbon-intensive grids — an indictment of the electricity, never a sustainability certificate for the methane (rule test-locked in the engine).[18]
7 · Fuel-chain efficiency — two charts, two units, never mixed
Chart A — well-to-shaft/thrust efficiency (share of input energy arriving at the shaft)
Units: fraction of input energy · Boundary: source → shaft/thrust · Status: derived from published stage data [17] · Ranges, not false precision
Table fallback — chain efficiencies
| Chain | Well→shaft/thrust | Note |
|---|---|---|
| Jet-A turbine | 0.28–0.31 | reference |
| LNG turbine | 0.26–0.31 | most efficient fossil chain; climate ledger separate |
| LH₂ combustion | 0.14–0.18 | low-carbon electricity basis |
| LH₂ fuel cell | ≈0.20 | FC efficiency recovers some liquefaction penalty |
| e-methane turbine | 0.15–0.17 | |
| e-kerosene turbine | 0.09–0.13 | electricity-hungry |
Chart B — primary-energy multiplier per ASK (aircraft level, design studies)
Observation — both cryogenic chains need more input energy than Jet-A; hydrogen's chain multiplier is the largest.
Meaning — fuel-chain efficiency, not aircraft aerodynamics, is where the energy penalty concentrates; design-study values, not flight measurements.
Units: × Jet-A per ASK · Boundary: well-to-wake per ASK · Status: estimated — aircraft-level design studies, NOT flight measurements [17,20]
Table fallback — ASK multipliers
| Aircraft/chain | × Jet-A per ASK | Status |
|---|---|---|
| Jet-A | 1.0× | fleet reference |
| LNG turbine | 1.0–1.1× | tank penalty small at long range |
| HEFA-SAF | ≈1.15× | drop-in |
| LH₂ turbofan | 1.6–2.0× | design study |
| LH₂ fuel cell | 1.7–2.3× | design study |
| e-methane | ≈1.9× | derived |
| e-kerosene | 2.5–3× | derived |
Reading the two charts together: LNG liquefaction uses ~30× less energy per kilogram than LH₂ liquefaction;[17] hydrogen's fuel-cell efficiency recovers some of that disadvantage at the shaft; but per-MJ-shaft results do not represent full-aircraft performance — tank mass, volume and drag must be included for mission conclusions, and today they exist only as design studies.
8 · Q17 sensitivity — what actually drives the answer
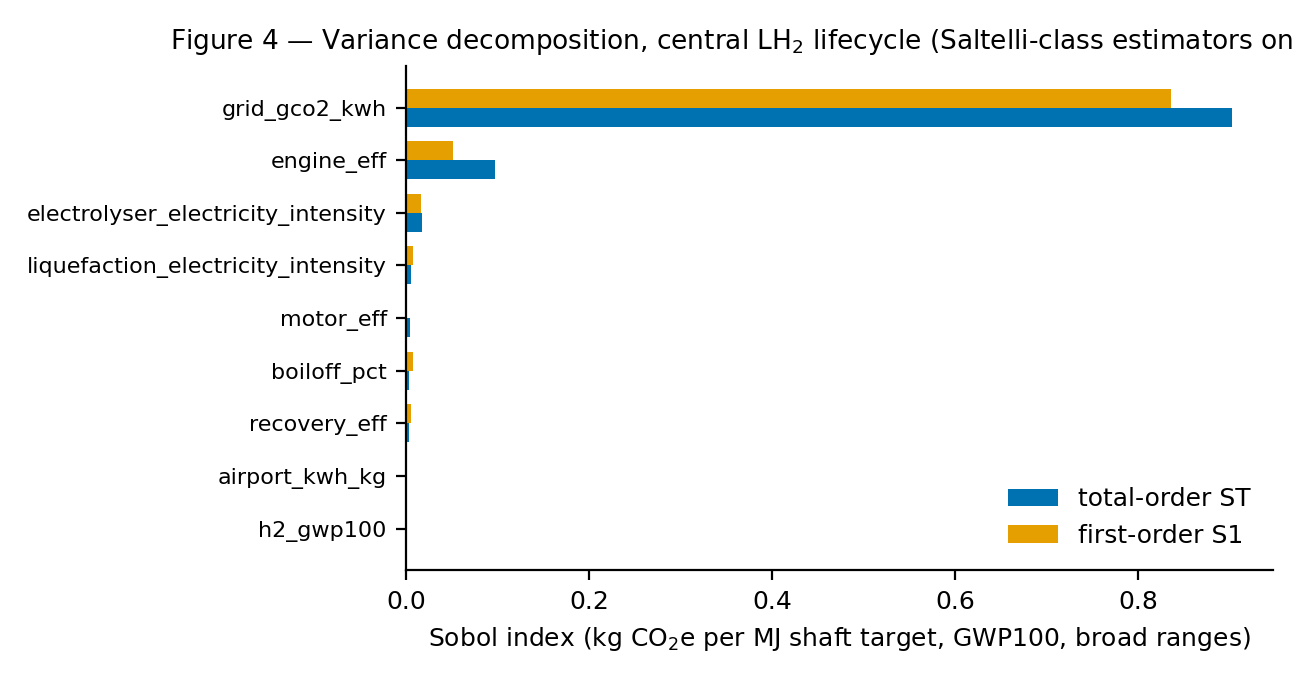
Observation — boil-off contributes ST ≈ 0.003; grid electricity carbon intensity contributes ST ≈ 0.9 class.
Meaning — within the tested range, electricity supply dominates by over two orders of magnitude; storage engineering matters, but decarbonised power matters far more.
Units: fraction of lifecycle CO₂e variance · Boundary: electricity→shaft · Distributions: uniform screening ranges in the Q17 module · Status: modelled; three estimators agree on the top-2 [18]
Table fallback — Sobol ST ranking
| Rank | Parameter | ST |
|---|---|---|
| 1 | grid carbon intensity | 0.901 |
| 2 | propulsion efficiency | 0.101 |
| 3 | electrolyser electricity intensity | 0.015 |
| 4 | liquefaction electricity intensity | 0.006 |
| 5 | motor efficiency | 0.004 |
| 6 | leakage / boil-off | 0.003 |
| 7 | airport infrastructure | 0.001 |
- Total-order Sobol values can sum above one because they include interaction effects (S1 and ST reported separately in the study).
- The "electrolyser efficiency" of the original study was verified to be electricity intensity (kWh/kg), not efficiency — its positive sign is correct for intensity; it has been renamed everywhere (PRCC +0.535 explained).
- The leakage/boil-off index was corrected to 0.003 from the higher value previously printed here, following the DL-060–064 platform audit's independent reconstruction of the sensitivity indices.
- Evidence-dependentOnce electricity falls below approximately 10–15 gCO₂e/kWh, fuel loss, recovery and propulsion assumptions become relatively more important; boil-off is a top-three hydrogen lever below ~10 gCO₂e/kWh.
9 · Conventional aviation baseline (EUROCONTROL SET v5.15)
As a regulatory empirical anchor for the incumbent: the EUROCONTROL Small Emitters Tool v5.15 (reporting year 2025).[19]
Jet-A CO₂ convention: 3.15 / 3.16 kgCO₂/kg · HyFlux energy-derived value 3.175 kgCO₂/kg retained separately (73.5 g/MJ × 43.2 MJ/kg; basis difference 0.48 %, documented)
- This is an entire-flight regulatory estimator — not a high-fidelity mission model, and not lifecycle emissions.
- It says nothing about alternative-fuel pathways; we do not use it to validate them.
10 · Based on the current evidence reviewed by HyFlux
Based on the current evidence reviewed by HyFlux, the present engineering direction remains liquid-hydrogen fuel-cell electric propulsion with superconducting machines, because it offers a credible route to true zero in-flight carbon emissions and can use the fuel's cryogenic state as a thermal resource.
That conclusion is conditional on: low-carbon electricity; measured and controlled hydrogen losses; integrated airport storage and recovery; high-efficiency propulsion; credible tank and aircraft integration.
Cryogenic methane remains technically relevant where: full-chain leakage is independently measured and very low; carbon provenance is verified; methane slip is controlled; lifecycle emissions outperform alternatives on an equal boundary.
HyFlux will not treat either pathway as low-carbon without measurement, traceability and full system accounting.
Readiness context: regional fuel-cell TRL 6–7 (flight-evidenced)[20] · LH₂ turbofan TRL 5–6 (2035 conceded dead; our roadmap 2040+)[21] · superconducting machines TRL 3–4 (ASCEND ~500 kW class, paused; we model to public MW-class data, not brochures)[22] · institutional scenarios converge on SAF-dominant 2050 with hydrogen secondary post-2035 and ~200 Mt residual[23] — we plan to that shape, not against it.
Engineering Discussion — model comparison and readiness (10a–10c)
10a · Comparison with Boeing CASCADE (July 2026 release)
This section is a technical comparison between two models with different objectives, based on Boeing's published documentation and explainer articles (July 2026). It is not a critique. Statements attributed to Boeing are taken from the cited sources; interpretations are identified as HyFlux's.
Methane GWP basis. Boeing's July 2026 technical documentation and the
accompanying explainer appear to use different descriptions for the methane
GWP₁₀₀ basis associated with the published loss carbon-intensity constant
(CIloss = 558 g CO₂e/MJ). The documentation describes the constant
as based on a GWP₁₀₀ of 29.8; the explainer cites a GWP₁₀₀ of 27.9 (Smith
et al., AR6 WG1 Supplementary Material). A value of 27.9 reproduces the
published constant exactly (27.9 × 1000 / 50 = 558), while 29.8 — the AR6
value including the fossil-carbon oxidation contribution — would give 596
(+6.8 %). The choice between the two is a documented methodological
question (whether the oxidised-CO₂ contribution of fossil-origin methane is
included) that warrants clarification rather than an error on either side.
HyFlux therefore retains both interpretations within the Evidence Register
(CH4_CI_LOSS: 558 on the CASCADE-parity track; 596 on the
independent track) and reports the sensitivity associated with each.
Hydrogen chain losses. Boeing's explainer provides present-system scenario estimates for cryogenic chain losses: liquid methane 1.6 % (12 % with poor management); liquid hydrogen 12.3 % (45.7 % with poor management). These are published scenario estimates synthesised from literature, not field measurements of an operating airport chain — none exists. They are consistent with the 45.7 % upper bound noted in HyFlux's earlier evidence-gap analysis, and they differ substantially from the 2 % design assumption ("expected vapor loss if no leakage occurs") used as a chain default. HyFlux carries all of these as distinctly-labelled register entries (measured observation, scenario assumption, design assumption, engineering estimate are separate evidence types), and its trajectory approach allows such values to evolve with technology deployment rather than remain fixed.
Modelling differences. The following differences represent different modelling objectives rather than competing methodologies:
| Topic | CASCADE | HyFlux |
|---|---|---|
| Methane leakage | Fixed scenario values | Annual trajectories |
| Hydrogen releases | Aggregate chain loss (cryogenic state; boil-off recovery term) | Six-mechanism architecture |
| Fossil CH₄ replacement | Not applied (docs eq 165); applied for biogenic (eq 166) | Applied uniformly via 1/(1−f) |
| Evidence | Published assumptions and parameter bounds | Canonical evidence register (typed, versioned, drift-guarded) |
| Uncertainty | Scenario comparison | Quantified uncertainty and sensitivity (MC/LHS/tornado/Sobol) |
| Purpose | Strategic transition modelling | Engineering lifecycle assessment |
Suggested future collaboration topics
- Region-specific, time-dependent or user-configurable methane leakage rates (measured basins span 0.19–9.4 %).
- Documented scope and bounds for gaseous-system hydrogen handling, venting and purge losses, and provenance of the boil-off-recovery default.
- Time-resolved carbon intensities for biogenic pathways, as already implemented for grid electricity.
- A published evidence register documenting source, confidence and uncertainty per lifecycle constant, which would also resolve the GWP-basis description above.
- Exposed output uncertainty bands and sensitivities alongside the existing parameter bounds.
10c · CASCADE V3.0 — reproduction update, 26 July 2026
Boeing released CASCADE V3.0 in July 2026, adding methane as a modelled aviation fuel, cost models, and horizons to 2100. We re-ran our reproduction against it. The values below were read from the public V3.0 web application in an anonymous, read-only session on 26 July 2026, with nothing altered or applied. That is a different provenance class from our earlier work, which used published documents only, and it is labelled as such throughout our register.
The application exposes hydrogen assumptions the documentation does not. Under Energy › Hydrogen: production energy intensity 1.35 MJ electricity per MJ H₂ (η ≈ 74 %); liquefaction energy intensity 0.30 MJ/MJ, equal to 10.0 kWh/kg LH₂; vapour loss 12 %; boil-off recovery off. The published equation page defines these symbols with units but no values. Two observations follow. First, 10.0 kWh/kg is a present-day conventional Claude-cycle plant — the same figure our own evidence register already carried — so the frequent characterisation of CASCADE as pessimistic on liquefaction is not supported. Second, the implied second-law efficiency is ≈ 0.41, which the documentation does not state, and no thermodynamic boundary is declared for the 0.30 value.
We could not reproduce the published hydrogen usable-fuel result, and we do not treat that as a defect. On the simplest boundary we can build from those four values — delivered fuel energy divided by electricity provided — we obtain 53 %, against a published chart value of about 38 %. We investigated and set aside loss algebra, ordering, rounding, heating-value conversion, percentage handling, repeated vapour loss, primary-energy normalisation and model-version provenance. The term usable fuel is not defined in the technical documentation we can access, and the published symbol for the number of liquefaction events carries no published value. Our conclusion is that the two figures may represent different quantities; equivalence is unproven in either direction and no model error is established. This is now a clarification question to Boeing, not a finding.
Lifecycle scope is selectable per fuel, and not symmetrically. The application offers independent well-to-wake / tank-to-wake selectors for conventional jet fuel, fossil methane, hydrogen and electricity; SAF and renewable methane have none, and are stated to be "always calculated using well-to-wake life cycle emissions values". Selecting tank-to-wake therefore narrows the boundary for the incumbent fuel while the alternatives retain their upstream burden — on CORSIA-consistent constants, about 17 % of the Jet-A1 baseline. There is a sound in-sector argument for that design; we have asked whether it is intentional rather than assumed it is not.
A correction to our own model, arising from the same review. The published power-to-gas hydrogen requirement is 1.14 MJ H₂ per MJ CH₄, described as a stoichiometric calculation based on the energy-content ratio. For the balanced Sabatier reaction CO₂ + 4H₂ → CH₄ + 2H₂O on a common LHV basis we calculate 1.20636. We tested common-LHV, common-HHV and both mixed bases, together with molar, volumetric and mass routes; none produces 1.14. We had carried 1.14 into our own independent physics model without re-deriving the reaction balance ourselves, and ran it that way. We have corrected it on our physics track while retaining 1.14 separately where the purpose is exact reproduction of the published methodology. The correction moved our e-methane usable-fuel figure by 2.2 percentage points and changed no classification. No number on this page depends on that constant, so nothing here is restated because of it. We have asked Boeing for the derivation rather than proposed a replacement.
Provenance: application observations are direct_observation,
V3.0, 26 July 2026, read-only. The 1.20636 value is derived_stoichiometric_floor
— HyFlux's own computation, not Boeing's value, and not attributed to them. The
liquefaction-count value that would reconcile the usable-fuel figures under our boundary is
a fitted_parameter and is held in our technical annex, not published as a
result: three other single-parameter fits reproduce the same target equally well, so the fit
demonstrates nothing about their model.
10b · Engineering Readiness Assessment
Maturity framework. Readiness is assessed on five related but distinct dimensions: engineering readiness (are the methods implemented and verified), scientific confidence (is the underlying science settled), evidence maturity (how strong is the input evidence), technology maturity (TRL of the modelled systems) and decision readiness (is the combination sufficient for consequential decisions). A model can be high on one dimension and low on another; collapsing them into one flag obscures where work remains.
Evidence maturity by type (register v1.3.0; every parameter carries one of these types):
| Evidence type | Strength | Review status | Improvement pathway |
|---|---|---|---|
| Measured field evidence | Strong where present (CH₄ basins, satellite; LH₂ sphere boil-off) | Published, peer-reviewed sources | Continuous monitoring; airport campaigns |
| Operator reporting | Moderate; known gap vs measurement (~+80 % sector-level) | OGMP 2.0 framework | L4/L5 measurement-based reporting |
| Laboratory data | Strong within scope | Published | Scale-up validation |
| Engineering estimates | Moderate; dominant for H₂ chain | PROVISIONAL in register | Replace with measurements as published |
| Scenario assumptions | Declared, not evidenced | Labelled SCENARIO | Convert to measured classes |
| Technology roadmaps | Targets, not demonstrated | Labelled TARGET | Deployment tracking |
| Expert judgement | Weakest; minimised | Flagged where used | Structured elicitation or replacement |
Readiness matrix:
| Capability | Status | Remaining work |
|---|---|---|
| Mass balance | Complete (8-dp identity tests) | None |
| Energy balance | Complete (external closures ≤8%) | None |
| Evidence register & traceability | Complete (typed, versioned, drift-guarded) | Continue updates |
| Sensitivity analysis | Complete (Sobol, LHS, tornado) | Extend to full pathway set |
| Methane measurements | Good | Continuous-monitoring ingestion |
| Leakage measurements (site-level) | Partial | Field validation |
| Technology trajectories | Developing (mechanism-specific, cited) | Deployment evidence |
| Hydrogen airport operations | Early (no operating chain exists) | Demonstration projects (GOLIAT-class) |
| Cost model | Partial | Whole-system economics module |
| External peer review | Planned | Independent publication |
Intended use. The current model is intended for comparative lifecycle assessment, engineering screening, scenario exploration and sensitivity analysis. It is not yet intended to be the sole basis for certification, regulatory approval, investment decisions or procurement, because: several hydrogen-chain inputs are engineering estimates or scenario assumptions rather than field measurements; the dominant uncertainty (transfer and chill-down release fate) is unmeasured; technology-adoption ramps are scenario constructs; and the model has not undergone independent peer review. Each of these maps to a specific row above rather than a general disclaimer.
Roadmap to decision-grade maturity (capability milestones): Phase 1 canonical evidence register — complete · Phase 2 technology-specific release mechanisms — complete · Phase 3 integration into headline results — complete (mechanism mode principal; independently reconstructed; parity bit-identical) · Phase 4 airport chain measurements — planned · Phase 5 independent peer review — planned · Phase 6 external engineering validation — planned · Phase 7 decision-grade release — target.
Metadata (four descriptors, never combined): software verification: 855 automated tests, drift-guarded register, reproducible builds · independent model comparison: cross-compared with Boeing CASCADE July 2026 (§10a) · physical validation: partial — external closures (H2Avia, Cirium-calibrated operations, canonical CFD cases); no airport hydrogen-chain measurements exist · external peer review: not yet undertaken (Phase 5). Evidence register v1.5.1 · paper v3 · model hyflux-lca-v5 · engine 5.0.0-dl085 · last reviewed 2026-07-24 · next review 2026-10 · DOI pending. Full V&V: paper Appendix D.
11 · Research gaps — on the record
- aviation aircraft-tank LH₂ boil-off under realistic turnarounds (never measured);
- airport-scale closed-loop LH₂ distribution at airline tempo;
- airport LNG leakage measurements (any);
- aviation methane-slip data in flight (marine analogues only);
- the vent / flare / capture fate of cryogenic transfer, chill-down and purge losses (§1's UNKNOWN card — the single most valuable measurement aviation hydrogen could commission);
- dynamic airport operational evidence (GOLIAT-class, 2024–2028, in progress);
- full-aircraft mass and aerodynamic integration penalties (design studies only);
- short-horizon non-CO₂ climate uncertainty (contrails, NOₓ, stratospheric water).
We do not fill these with averages. They stay Unknown until measured.
Scientific Appendix — references, governance and verification (12–13)
12 · References
- Alvarez et al., Science 361:186 (2018) — US oil-and-gas methane 2.3 % of gross production, ~60 % above EPA.
- Riddick et al., ACP (2019) — UK North Sea platform leakage 0.19 % collective.
- Zhang et al., Science Advances (2020) — Permian 3.7 % (TROPOMI inversion).
- Chen et al., ES&T (2022) — New Mexico Permian 9.4 % (airborne hyperspectral).
- Chen et al., ACP (2023) — Qatar/Kuwait/Saudi ≤0.2 % upstream intensity class.
- Bakkaloglu et al., Waste Management (2021) / One Earth (2022) — UK biomethane chain 3.7 % mean; global synthesis >2× previous estimates.
- Lauvaux et al., Science (2022) — ultra-emitters 8–12 % of global O&G methane.
- European Commission, Methane emissions (energy.ec.europa.eu, fetched 19 Jul 2026) — the EU page prints GWP 29.88 / 82.5 (AR6 fossil-specific basis); this page uses the IPCC AR6 origin-neutral class values 29.8 / 80.0, a declared ≈3 % basis divergence, documented in the model. 3 % coal-equivalence reference; Regulation (EU) 2024/1787 + OGMP 2.0 MRV. Cross-checked:
validation/VAL-EU-METHANE-2024.json. - HyFlux evidence review,
research/EVIDENCE-methane-leakage-chain.md(2026) — break-even 0.9–1.4 % (GWP20) / 2.6–3.8 % (GWP100), derived from [1–8]; renewable-credit proof. - Sand et al., Communications Earth & Environment 4:134 (2023) — H₂ GWP100 11.6 ± 2.8, GWP20 37.3 (five-model ensemble).
- Warwick et al., ACP 23:13451 (2023) — H₂ GWP100 12 ± 6 (UKESM1).
- Hauglustaine et al. (2022) — H₂ GWP100 12.8 ± 5.2 (GFDL).
- Derwent (2023) — H₂ GWP100 8 ± 2 (minority estimate, retained).
- Fesmire et al., NASA NTRS 20210018309 (2021) — large LH₂ storage 0.048–0.1 %/day; glass bubbles −46 %.
- Notardonato et al., NASA NTRS 20170006481/20180006814 (2017–18) — GODU-LH2 zero-boil-off, 390 W @ 20 K, TRL 6.
- HyFlux v5 module,
src/engine/v5/(hyflux-lca) — 13-stage LH₂ chain, methane chain, climate modules, break-even engine;docs/v5-fugitive-emissions-report.md; decision logs V5-DL-050–076 (platform audit DL-060–064). - HyFlux evidence review,
research/EVIDENCE-fuel-chain-efficiencies.md(2026) — identical-boundary chain efficiencies; liquefaction 10–13 kWh/kg actual vs 3.3–3.9 minimum; LHV/HHV traps. - HyFlux Q17 study,
app/v2/lifecycle_sensitivity.py+src/engine/v5/+docs/q17/— Sobol/Morris/PRCC/Monte-Carlo, 9 grid regimes, break-even maps, robustness; decision log DL-065–072. - EUROCONTROL, Small Emitters Tool v5.15 (2025) — fleet fuel-burn models; cross-checked:
validation/VAL-EUROCONTROL-SET-2025.json. - ZeroAvia (ZA600/Do228, 2023) · H2FLY (HY4 LH₂, 2023) · Joby (523-mile, 2024) — regional fuel-cell flight evidence (EVIDENCE-aircraft-cryo-architectures.md).
- Rolls-Royce AE2100-A (2022) + Pearl 700 100 % H₂ ground tests (2023–24); Airbus 2025 H₂ rescope (2035 conceded) — LH₂ turbofan readiness.
- Airbus ASCEND programme (~500 kW class ground demonstrator, paused 2025); ASuMED 1 MW MgB₂ motor (~20 kW/kg, 20–25 K) — superconducting readiness datum.
- IEA NZE · ICAO LTAG · ATAG Waypoint 2050 · Destination 2050 · Royal Society (2023) · ICCT — institutional scenario convergence (EVIDENCE-liquefaction-feasibility.md).
- Boeing CASCADE V2.7 public documentation (docs.cascade.boeing.com) + HyFlux comparison (
frontend/HyFlux-vs-CASCADE-Comparison.docx) — methodology parity basis. - Boeing CMO 2026 workbook + Airbus GMF 2026-2045 workbook — traffic/fleet anchors (
validation/VAL-CMO-2026.json,VAL-AIRBUS-GMF-2026.json).