Fugitive Emissions, Cryogenic Losses and Infrastructure Trade-offs in Hydrogen and Methane Aviation Pathways
Fugitive Emissions, Cryogenic Losses and Infrastructure Trade-offs in Hydrogen and Methane Aviation Pathways
HyFlux LCA v5.0 Publication Report (v3)
Publication panel (all fields consistency-checked against the canonical build manifest (governance appendix))
| Field | Value |
|---|---|
| Report version | v3, revised 2026-07-24 |
| Model / engine | hyflux-lca-v5 / 5.0.0-dl085 |
| Evidence register | v1.4.0 |
| Software verification | complete (automated suite; count in manifest) |
| Independent reconstruction | complete for the mechanism-ledger scope (Python vs TypeScript, 10 dp) |
| Physical validation | partial — no operating LH₂ airport chain exists |
| External peer review | not completed |
| Engineering readiness / decision grade | Tier 1 screening / false |
| DOI | pending |
Software verified and independently reconstructed for the mechanism-ledger scope; partially validated against external datasets. The aviation fuel-chain model has not yet been physically validated against a representative operating hydrogen airport chain or independently peer reviewed. Remaining before publication: reference metadata gate (Appendix B), external review. Every public number carries pathway, functional unit, boundary, GWP horizon, scenario and evidence status in the machine-checked claims register. Internal decision-log identifiers appear only in the governance appendices.
Abstract
Liquid hydrogen (LH₂) and liquid methane (LCH₄) are candidate aviation energy carriers whose climate performance is dominated by supply-chain behaviour rather than combustion alone. This study introduces a six-mechanism hydrogen-release architecture — fugitive leakage, planned venting, operational purging, cryogenic boil-off, transfer & chill-down, and abnormal releases — in which each mechanism carries its own evidence, uncertainty, recovery fraction, atmospheric fate and technology trajectory, with replacement production charged only for hydrogen that leaves the useful fuel system. Under this HYFLUX MECHANISM MODEL, central modelled atmospheric hydrogen release is 11.1 kg/day per 1,000 kg/day delivered, with 1.5 kg/day of explicitly unresolved transfer fate and 12.7 kg/day of replacement production; the frozen aggregate representation (20.0 kg/day, PARITY/LEGACY) is retained numerically identically for historical and Boeing CASCADE comparison. The reduction from 20.0 to 11.1 kg/day results from mechanism-specific recovery and replacement accounting; it is a methodological revision, not a new physical measurement. The ledger is independently reconstructed from the evidence register alone in a separate Python implementation agreeing with the engine to ten decimal places. Methane leakage anchors on measured classes (0.19–9.4 % of production); hydrogen's indirect warming carries a published four-model ensemble. The principal conclusions are structurally unchanged: grid carbon intensity remains the dominant contributor to lifecycle-output variance (Sobol ST 0.901 within tested ranges), transfer-related operations remain the dominant hydrogen measurement priority, and the boil-off and break-even findings retain their regime structure. No universal fuel preference is supported; the result is a regime map conditioned on grid carbon intensity and certified leakage. (≈270 words)
Executive summary
What problem was studied? Whether liquid hydrogen or liquid methane offers the lower lifecycle climate impact for aviation, on a strictly identical boundary, when supply-chain releases, cryogenic losses and infrastructure energy are accounted honestly. What was discovered? The answer is a regime map, not a verdict: grid carbon intensity dominates; hydrogen-release behaviour, once resolved into six physical mechanisms with recovery and fate, is smaller than the legacy aggregate implied (11.1 vs 20.0 kg/day per 1,000 kg/day) but its largest component remains unmeasured. Why does it matter? Fuel-choice decisions hinge on electricity supply and measured releases, not on fuel identity. What should engineers measure next? The vent/flare/recover split of transfer and chill-down operations — the single highest-value measurement in aviation hydrogen.
What model is now used? The HYFLUX MECHANISM MODEL: six physical hydrogen-release mechanisms, each with register-governed evidence, recovery, atmospheric fate, uncertainty and technology trajectory. What changed? The former single aggregate chain-loss factor no longer drives headline results; it is retained as a less granular representation (PARITY / LEGACY) for historical reproducibility and CASCADE comparison — it is not described as incorrect. Current headline results (central fate case, 1,000 kg/day delivered):
| Quantity | Parity / Legacy | HyFlux Mechanism Model | Interpretation |
|---|---|---|---|
| Atmospheric release | 20.0 kg/day | 11.1 kg/day | recovery credited by mechanism |
| Unresolved atmospheric fate | aggregate historical treatment | 1.5 kg/day | remains explicit, never zeroed |
| Replacement production | legacy aggregate basis (20.4) | 12.7 kg/day | recovered hydrogen is not replaced |
| Primary purpose | model parity | engineering analysis | primary analytical configuration |
Which conclusions changed? The central hydrogen-release and replacement quantities, and the presentation of the historical 72.44 kg/day generated-loss figure (§5.2b). Which did not? Electricity dominance, the break-even regime structure, the three-pathway methane separation and the liquefaction asymmetry (§§5.4–5.6). The revised accounting does not itself constitute physical validation: no representative operating LH₂ airport chain has been measured, and transfer-related operations remain the highest-value measurement aviation hydrogen could commission.
1. Introduction
Cryogenic aviation fuels move the climate question upstream: the decisive emissions arise in electricity supply, liquefaction, storage and transfer rather than at the exhaust alone. Public debate nonetheless runs on single numbers — "boil-off is hydrogen's Achilles heel", "methane leakage cancels its potency advantage" — which this study replaces with computed, boundary-explicit regime maps. This is the publication text of the HyFlux LCA v5.0 fugitive-emissions and cryogenic-infrastructure results, revised after an independent audit (Appendix A), its corrections (Appendix A) and a horizon-consistency completion (the horizon-completion revision (Appendix A)).
1.1 Novel contributions
- A six-mechanism hydrogen-release ledger — fugitive leakage, planned venting, operational purging, cryogenic boil-off, transfer & chill-down, abnormal releases — with separate quantities for hydrogen generated as vapour, recovered, returned to stock, beneficially consumed, released to atmosphere, unresolved fate, and replacement production; each mechanism carries its own evidence, recovery, uncertainty and technology trajectory (register v1.5.1).
- A frozen aggregate parity mode (numerically identical to prior reference outputs) alongside the mechanism-level representation, plus an independent Python reconstruction from the evidence register alone that matches the TypeScript engine to ten decimal places, all under a canonical publication manifest and claims-governance architecture. The 13-stage LH₂ chain (per-stage mass closure ≤1e-9) and the fate-conditional 15.40×/≈1.11× boil-off-subset bracketing are retained within this architecture as the historical aggregate derivation.
- Structural pathway separation for methane — fossil, biomethane, e-methane never blended — with an executable proof that leakage forcing survives carbon-cycle origin.
- An equal-boundary, equal-shaft-energy LH₂/LCH₄ comparison published as a cell-wise break-even map rather than a single preference.
- Code-enforced ledger discipline: vapour generation ≠ emission; climate impact ≠ replacement energy; GWP20 and GWP100 never mix within a ledger (Appendix A).
- Machine-checked claims governance: every public number in an 18-column register recomputed from the modules by tests, with a guard against a withdrawn figure's reappearance.
- A neutral, four-way-classified parity comparison against an independent reconstruction of Boeing's public CASCADE energy equations, with a symmetry statement covering this model's own audited defects.
2. Research questions
- Q1. How much hydrogen is generated, recovered, returned, consumed, released to atmosphere or left with unresolved fate across the six release mechanisms, and which mechanism dominates expected release and uncertainty?
- Q2. How do mechanism-level and aggregate parity representations differ in atmospheric release, replacement production and lifecycle climate impact?
- Q3. How do fossil LNG, biomethane and e-methane compare when supply leakage, engine slip and carbon origin sit on separate ledgers?
- Q4. Under an identical boundary and equal shaft energy, in which grid/boil-off/leakage regimes does LH₂ out-perform LCH₄?
- Q5. Which parameters dominate lifecycle-CO₂e variance, in which grid regimes, and how stable is the ranking?
- Q6. How sensitive are conclusions to the climate-metric basis (GWP20 versus GWP100; CH₄ 29.8/80.0 versus the site's 29.88/82.5)?
- Q7. Where does HyFlux agree with, and where does it represent things differently from, Boeing's CASCADE energy model, stated neutrally?
3. Methods
Question this section answers: how are two fuel chains modelled so that every release, recovery and unit of energy is attributable and comparable on an identical boundary?
Evidence key used throughout: measured (field measurement), lab (laboratory), operator (operator-reported), estimate (engineering estimate), scenario (scenario assumption), target (technology roadmap), modelled/computed (model output). Values in prose carry engineering precision; full precision lives in the downloadable datasets and regression artefacts (governance appendix).
3.1 System boundary and functional units
One Boundary object serves both fuels: UK, 2035, grid 50 gCO₂e/kWh central, 1,000 kg/day airport demand, 5,000 MJ shaft mission, 150,000 pax-km; results per MJ shaft and per mission, split into well-to-airport, airport-to-tank and tank-to-shaft ledgers; lower heating values throughout. The comparison equalises delivered useful shaft energy (5,000 MJ per mission for both fuels); it does not assume identical propulsion. Tank-to-shaft conversion is fuel-specific and declared: η_LH₂ = 0.465 (fuel cell 0.50 × electric drivetrain 0.93) and η_LCH₄ = 0.45 (turbine class). Equal shaft output therefore implies unequal upstream fuel energy — 5,000/0.465 ≈ 10,753 MJ of LH₂ against 5,000/0.45 ≈ 11,111 MJ of LCH₄ — and every upstream release, liquefaction load and carbon intensity scales from that fuel demand, not from the shaft figure.
3.2 Mechanism-Level Hydrogen Release Model
Hydrogen released from the fuel chain is modelled as six independent physical mechanisms — fugitive leakage, planned venting, operational purging, cryogenic boil-off, transfer & chill-down, and abnormal releases — each defined by lifecycle stage, input quantity, generated vapour, recovery fraction, return-to-stock fraction, atmospheric-fate fraction, unresolved-fate fraction, replacement implication, evidence type, uncertainty and annual technology trajectory (all register-governed, v1.4.0; units % of delivered throughput unless stated). Mass-balance identity, per mechanism and year:
hydrogen entering = hydrogen delivered + recovered/returned + beneficially consumed + released to atmosphere + unresolved fate
with atmospheric release = (gross − unresolved) × fate-fraction × (1 − recovery-fraction).
Basis convention (mass conservation). All mechanism rates are expressed per unit of hydrogen delivered; the replacement relation f/(1−f) is the exact conversion to the produced basis, since m_produced = m_delivered + m_atmospheric + m_unresolved (recovered, returned and beneficially consumed mass cycles inside the boundary and appears on both sides of the balance). The distinction between the two bases is second-order (≈1 % of the release terms) and lies below the 0.1 kg/day rounding used in the tables. Partition order. For each mechanism the gross generation is partitioned in a fixed order: (1) the unresolved-fate share is held out and never silently reassigned; (2) the remainder splits by the declared atmospheric-fate fraction into an atmosphere-directed stream and a returned/consumed stream; (3) recovery intercepts only the atmosphere-directed stream — it can never claim mass that was already returned or consumed, which is what prevents double-counting. Fate cases. Three cases bound the headline results: central uses the declared register fractions; lower increases each recovery fraction by 0.30 (capped at 0.95); upper treats all unresolved mass as vented, sets the atmospheric-fate fraction to 1.0 and degrades recovery by 0.30. By construction the mechanism centrals sum to the aggregate reference value (2.0 % of delivered mass), so the two representations share one gross-generation basis at the base year. Two further conventions are declared: the chain is evaluated on a quasi-steady daily-average basis (no diurnal or seasonal resolution at this layer), and mechanism fate/recovery fractions are treated as statistically independent — no common-cause correlation (for example, a site-wide recovery-system outage) is modelled; a correlated (copula) layer is identified future work. Replacement hydrogen is charged only for material that leaves the useful fuel system and must be replaced to satisfy delivered-fuel demand; recovered, re-liquefied, returned or beneficially used hydrogen is never charged replacement production. Abnormal releases carry a frequency basis and are reported separately from routine totals.
3.2a Calculation modes
HYFLUX MECHANISM MODEL — primary engineering mode; drives all headline results; mechanism-level recovery, fate, evidence and uncertainty. PARITY / LEGACY — the frozen aggregate chain-loss representation, numerically identical to previously reference outputs; retained for historical reproducibility and Boeing CASCADE comparison; not the primary HyFlux engineering result. PROJECT DATA — measured site-specific inputs with mandatory provenance, denominator, date, boundary and measurement status; outputs stamped project-specific. No result mixes assumptions across modes unless explicitly presented as a comparison.
3.2b Historical aggregate LH₂ chain (parity basis)
The prior thirteen-stage chain (per-stage mass closure ≤1e-9; nine vapour-management scenarios at storage stages; storage boil-off anchored on measurement, 0.048–0.1 %/day, Fesmire et al., 2021; re-liquefaction charged at 10 kWh/kg) is retained unchanged as the parity basis. Its the transfer-loss-fate parameter parameter and the historical 72.44 kg/day aggregate generated-loss output are superseded in headline results by the mechanism ledger (§5.1) but remain reproducible in the aggregate reference representation.
3.3 Methane chain model
Composition and mass-basis declaration: this model uses a pure-methane basis — LHV 50 MJ/kg, methane mass fraction 1.0. Real LNG is a mixture (LHV ≈ 48.6–49.5 MJ/kg), so per-MJ carbon intensities on a mixture basis differ by ≈2–3 %; the pure-CH₄ convention is declared rather than hidden, and all leakage percentages are METHANE-mass fractions — because GWP applies per kilogram of methane released, leakage of a mixture must be scored on its methane fraction, not total LNG mass. A mixture-composition option is register-work for a future revision.
Fourteen stages; ten loss categories that never blend (fugitive, pneumatic, maintenance, emergency, boil-off, vented, re-liquefied, process fuel, slip, combustion). The bottom-up inventory is constrained by the top-down anchors of Table 1, with super-emitters as a lognormal body plus Pareto tail (p99/p50 > 5, independently verified; Lauvaux et al., 2022).
3.4 Climate-metric ledgers
CH₄ at AR6 GWP100 29.8 and GWP20 80.0 (origin-neutral class value; the fossil-specific 82.5 printed by the European Commission (2026) and the HyFlux site is a declared ≈3 % divergence; IPCC, 2021). Hydrogen's indirect warming keeps its own ledger, carrying the four published models of Table 5 side by side. The renewable-credit proof is executable: a leaked kilogramme of CH₄ forces 80.0 kg CO₂e20 (29.8 kg CO₂e100) regardless of carbon origin; biogenic/DAC credits apply only to the combusted fraction.
3.5 Equal-boundary comparison
Both fuels are evaluated on the §3.1 boundary with per-fuel declared efficiencies, producing ledger rows in both CO₂e20 and CO₂e100 that are summed only at reporting time; mass and carbon closures ≤1e-6 kg.
3.6 Sensitivity and break-even analysis
Morris screening (r = 24), Saltelli-class Sobol estimators on scrambled Latin-hypercube samples (honestly named — not a Sobol low-discrepancy sequence), Monte Carlo (8,000–20,000), tornado, and cell-wise break-even maps. The LH₂/LCH₄ map (sensitivity.ts::breakEvenMap) spans grid 0–250 gCO₂e/kWh × boil-off multiplier 0–2× reference (11 × 9 = 99 cells); its LCH₄ opponent is priced per pathway — the default configuration is the e-methane (DAC-carbon) parameterisation (synthesis electricity 25 kWh/kg × grid CI, no combustion CO₂), and fossil: true prices the fossil opponent (combustion CO₂ counted, no synthesis electricity); both are reported in §5.5 (opponent labelling per an engineering revision (Appendix A)). The hydrogen-only map (breakeven-hydrogen.ts) spans the same grid range with its second axis as absolute boil-off 0–10 % — numerically 0–2× a 5 % reference: identical coverage, non-interchangeable axis labels. Robustness: 3 seeds × {20k, 100k} samples × {broad, narrowed} ranges × both horizons.
3.7 Separation disciplines
Two separations are module-enforced: vapour generation is not atmospheric emission (only the vented stream of the recovered/consumed/re-liquefied/vented partition enters a warming ledger), and climate impact is not replacement-fuel energy (indirect warming, leakage forcing, slip, process fuel and combustion CO₂ occupy separate ledger lines). Leakage (supply-chain loss) is never conflated with slip (unburned fuel through the engine).
3.8 Parameter governance
Every parameter carries a six-level evidence status (observed / published / derived / scenario / estimated / unknown) with source, date, equation, boundary and confidence in the supplementary materials (Appendix F). Where no public evidence exists the value is declared Unknown and dependent results inherit the declaration; the three central Unknowns (aircraft-tank boil-off, airport LNG operations, aviation methane slip) propagate to §7.
3.9 Software and determinism
All v5 analysis lives in the additive TypeScript module the supplementary materials (Appendix F) (strict mode; the validated v4.0 engine read-only), deterministic via seeded generators; every figure and table regenerates from the repository (the figure-data supplement (Appendix F)) and is pinned by the 685-test suite.
4. Verification
Question this section answers: why should a reader trust these numbers — and precisely which kinds of trust (software, reconstruction, physical) are earned?
Scope statement. Three things are distinguished throughout and never combined: internal software verification (automated tests, mass balance, dimensional checks, claims-register parity, manifest drift tests, frozen legacy pins); independent reconstruction — a separate Python implementation reads the canonical evidence register without importing the TypeScript engine and reconstructs every mechanism-ledger row and total, with agreement enforced to ten decimal places; this independently reconstructs the mechanism accounting and verifies implementation consistency, it does not physically validate airport release rates; and physical validation — external datasets calibrate or validate specific modules (methane basin classes, stationary boil-off rates, EUROCONTROL SET baseline, Cirium operations), but no representative operating aviation LH₂ airport chain currently validates the complete mechanism-led release result. Test counts and versions are stated only in the publication panel, generated from the build manifest.
4.1 Determinism and mass closure. All estimators run on fixed seeds and every artefact regenerates deterministically, so any reader with the repository reproduces every number bit-for-bit. Per-stage and whole-chain balances close to ≤1e-9 relative (LH₂ chain) and ≤1e-6 kg (comparison ledgers) under every vapour scenario and every transfer-loss fate; closure is asserted in tests, not assumed.
4.2 Independent reconstruction (Appendix A) — distinct from self-tests. The platform-series audit reconstructed the venting scenarios, both break-even maps, the Sobol indices and the methane break-even band with its own estimators and random-number generator, accepting nothing from this model's self-tests. Self-tests demonstrate internal consistency; the audit's agreement (e.g. grid ST 0.903 against the published 0.901) is external replication.
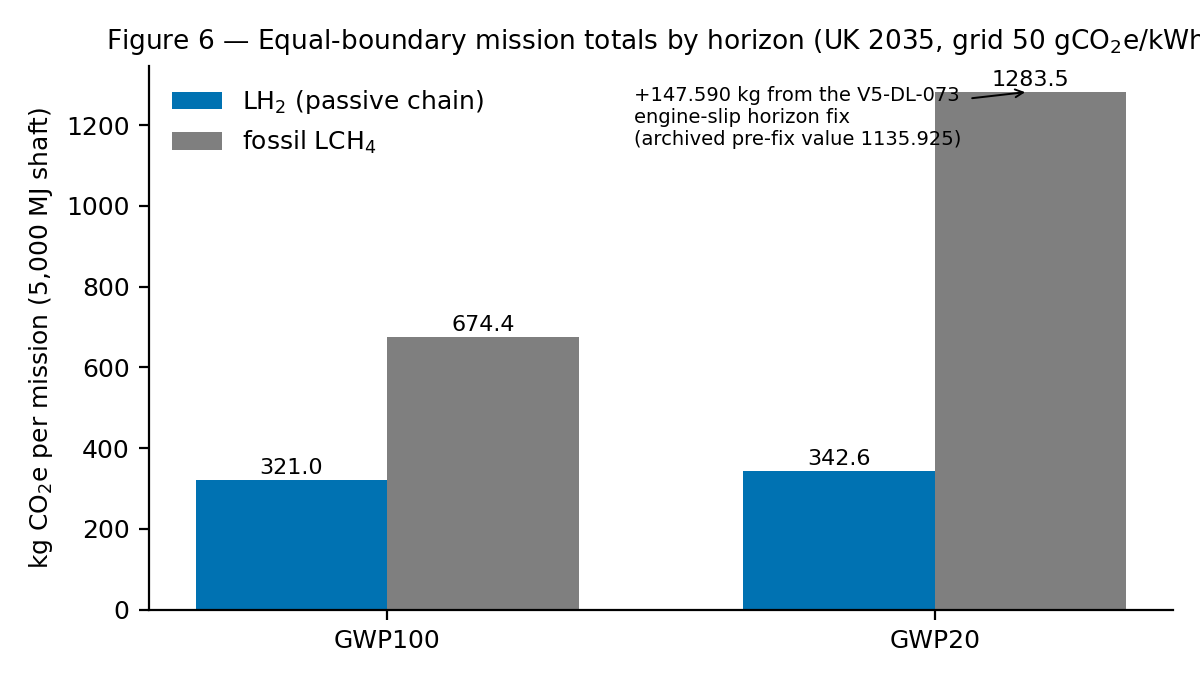
4.3 Audit corrections (Appendix A) and horizon completion (the horizon-completion revision (Appendix A)). Seven defects were corrected (Appendix A); the only MAJOR item (C1) was boundary honesty, not arithmetic, and corrections moved in both directions — C4 reduced hydrogen's warming line by 15.56 %; C6c raised methane's 20-year total — so none was directionally convenient. The one documented residual of C6c (the engine-slip row still at GWP100 inside the CO₂e20 output) was then fixed as the horizon-completion revision (Appendix A): the central fossil mission's CO₂e20 moved from 1136 to 1284 kg (+147.590 kg, +13.0 %); CO₂e100 outputs are unchanged by construction.
4.4 Regression locking. Every corrected value carries a reference-value verification: register-vs-code recomputation, old-versus-new reconstruction for the horizon-completion revision (Appendix A), and a guard that fails if the withdrawn crossover figure reappears in publication documents.
4.5 CASCADE parity as external cross-check. An independent re-implementation of Boeing's public CASCADE energy equations (fetched live during the audit: equations 137–148 and parameter-bounds pages, accessed 19 July 2026) reproduces the hydrogen delivered-CI closed form, the make-up/recovery/re-liquefaction structure and the two-mode electricity treatment (Boeing, 2026a). Agreement between independently built models corroborates both; it proves neither.
5. Results
Question this section answers: what do the mechanism ledger, the pathway comparison and the break-even maps actually show within the tested domain?
Functional units are stated per result; "central" means the §3.1 boundary; status labels follow the claims register.
5.1 Mechanism-Level Hydrogen Ledger (HYFLUX MECHANISM MODEL — principal result)
Question: where does generated hydrogen vapour actually go? Method: register-governed six-mechanism ledger, central fate case. Result: 20.0 generated → 11.1 atmospheric, 3.1 recovered, 4.4 returned/used, 1.5 unresolved (kg/day @1,000 kg/day delivered). Interpretation: recovery and fate must be explicit — an aggregate factor overstates atmospheric release by ~80 %. Limitations: modelled, not measured; fate fractions are register scenario values.
Central fate case, base year, 1,000 kg/day delivered. All values modelled (not measured); totals generated directly from the mechanism ledger and matched by the independent Python reconstruction to ten decimal places.
| Mechanism | Generated | Recovered | Returned/used | Atmosphere | Fate unresolved | Evidence status |
|---|---|---|---|---|---|---|
| Fugitive leakage | 3.0 | 0.0 | 0.0 | 3.0 | 0.0 | engineering estimate |
| Planned venting | 3.0 | 0.9 | 0.0 | 2.1 | 0.0 | engineering estimate |
| Operational purging | 3.0 | 0.6 | 0.0 | 2.4 | 0.0 | engineering estimate |
| Cryogenic boil-off | 6.0 | 1.2 | 3.6 | 1.2 | 0.0 | direct measurement (stationary) |
| Transfer & chill-down | 3.0 | 0.4 | 0.8 | 0.4 | 1.5 | engineering estimate, fate unmeasured |
| Abnormal releases | 2.0 | 0.0 | 0.0 | 2.0 | 0.0 | scenario (frequency class) |
| Total (kg/day @1,000 kg/day delivered) | 20.0 | 3.1 | 4.4 | 11.1 | 1.5 | ledger-generated |
Rows are independently rounded to 0.1 kg/day; exact ten-decimal values are in Appendix E and the downloadable dataset, so rounded rows and totals may differ by ±0.1. This is a MASS ledger: recovered and returned hydrogen stays in-boundary, but the electricity required to re-liquefy it is not free — that energy penalty is charged through the liquefaction line of the carbon-intensity calculation, not in this table.
Central modelled atmospheric release is 11.1 kg/day; unresolved fate 1.5 kg/day (transfer — held visible, bounded by the upper fate case); replacement production 12.7 kg/day (recovery credited; recovered hydrogen is not replaced). The principal mechanism by expected release is fugitive+purging+venting collectively; the dominant measurement uncertainty is transfer & chill-down (register range 0–2.0 % of throughput). The central result is falsifiable: the proposed transfer-chain instrumentation campaign would measure vent-stack flow directly, and a sustained reading materially above ≈0.9 % of throughput (the upper fate case) or below ≈0.2 % (the lower case) would refute the central fate allocation, not merely refine it. Quantified uncertainty (Beta-distributed fate and recovery fractions, seeded Latin-hypercube propagation, independence declared): central atmospheric release carries a combined standard uncertainty u_c with expanded uncertainty U = 2u_c (~95 %) reported in the verification appendix; abnormal releases additionally carry a Poisson loss-of-containment basis (register v1.5.1) and are never added to routine totals without it.
5.2 Mechanism Model versus Aggregate Parity
The PARITY / LEGACY representation reports 20.0 kg/day atmospheric release — every generated kilogramme vented by definition, with no recovery, return, beneficial-use or unresolved-fate categories. The 8.9 kg/day difference decomposes as: 3.1 recovered, 4.4 returned/used (boil-off re-liquefaction and process return), 1.5 moved to explicit unresolved fate. The 11.1 kg/day result is modelled, not measured; the legacy figure is a less granular representation retained for parity and CASCADE comparison, not an error.
5.2b Boil-off architecture result (subset finding, unchanged)
Closed vapour management cuts venting from 8.62 to 0.560 kg/day on the boil-off subset (15.40×, modelled; audit-reproduced). This subset finding is structurally unchanged under the the mechanism-level representation but is not the whole atmospheric-release story: the principal full-ledger result is 11.1 kg/day, and transfer remains the largest measurement priority. From register v1.5.1 the transfer stage table is derived from first principles rather than class estimates: chill-down mass from the metal-enthalpy balance m_H₂ = m_metal·∫c_p dT/h_fg, flash quality from isenthalpic letdown x = c_p,liq·ΔT_sat/h_fg (0.25 bar letdown ⇒ x ≈ 2.2 %), purge from displaced volume × gas density, and disconnect heel from trapped volume × liquid density — all over a declared, site-measurable hardware inventory (24 kg line, 16 kg interface, 1.48 m³ purge volume, 26 L heel; Appendix E). The physics is exact given the hardware; the hardware declaration is what the instrumentation campaign would verify, and the atmospheric fate remains unmeasured (unchanged). Storage boil-off follows the heat-leak law BOR = U·(A/V)·ΔT/(ρ h_fg) with vacuum-perlite-class U = 0.0048 W/m²K reproducing the measured 0.048–0.1 %/day sphere range and giving the declared 1/r scaling for sphere-to-vessel extrapolation. Liquefaction is anchored by the second law: ideal work 3.92 kWh/kg (including ortho–para conversion), so every technology is a bounded exergy efficiency η_II — conventional Claude plants η_II ≈ 0.39 (10 kWh/kg, the model reference), large optimised cycles ≈ 0.61 (6.4), and magnetocaloric active-magnetic-regenerative liquefiers a TARGET ≈ 0.78 (5.0 kWh/kg, TRL 3–4 laboratory prototypes; requires superconducting magnets — a shared technology base with the superconducting-propulsion pathway; never presented as demonstrated at plant scale).
The historical 15.40× versus ≈1.11× all-losses-vent bracketing is a historical aggregate sensitivity (parity basis, §3.2b): the historical 72.44 kg/day was the aggregate generated-loss output, since decomposed mechanism-by-mechanism with recovery credited (Appendix E); it remains reproducible in the aggregate reference representation and is no longer the current unresolved-atmospheric-fate result.
5.3 Methane: three pathways, three numbers
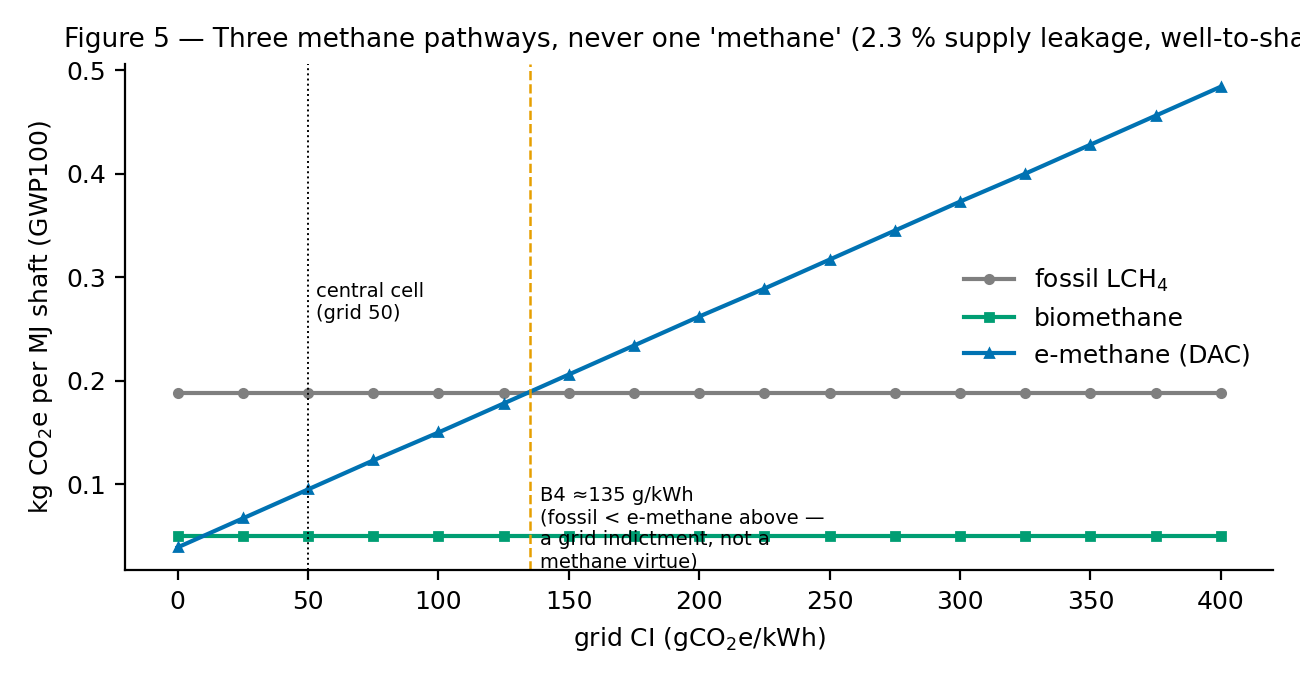
Per MJ shaft at the central cell (grid 50 g/kWh, upstream leakage 2.3 %, liquefaction 0.2 %, airport 0.1 %, slip 0.3 %, η 0.45, GWP100; computed, audit-corrected scale): fossil 0.188, biomethane 0.050, e-methane 0.095 kg CO₂e/MJ shaft (Figure 5). The leakage classes are measured anchors, not tuning knobs (Table 1); the UK biomethane chain's measured 3.7 % (Bakkaloglu et al., 2021, 2022) is the awkward case for the "renewable methane is clean" intuition, and leakage forcing is never cancelled by carbon-cycle origin. E-methane's line crosses fossil's at the computed B4 threshold ≈135 g/kWh. Slip is a separate ledger line: across the marine-analogue range 0.1–3.5 %, the fossil CI moves 0.079 → 0.119 kg CO₂e/MJ shaft (+52 %; provisional — no flight measurement).
Table 1 — Methane supply-leakage evidence classes (% of production; CSV: tables/table1-leakage-classes.csv)
| Class | Leakage | Source |
|---|---|---|
| UK offshore (measured) | 0.19 % | Riddick et al. (2019) |
| Certified-low fossil (Qatar-class) | ≤0.2 % | Chen et al. (2023) |
| US average (fossil) | 2.3 % | Alvarez et al. (2018) |
| Permian satellite (worst basin) | 3.7 % | Zhang et al. (2020) |
| UK biomethane chain | 3.7 % | Bakkaloglu et al. (2021) |
| Permian aerial (worst basin) | 9.4 % | Chen et al. (2022) |
5.4 Variance decomposition
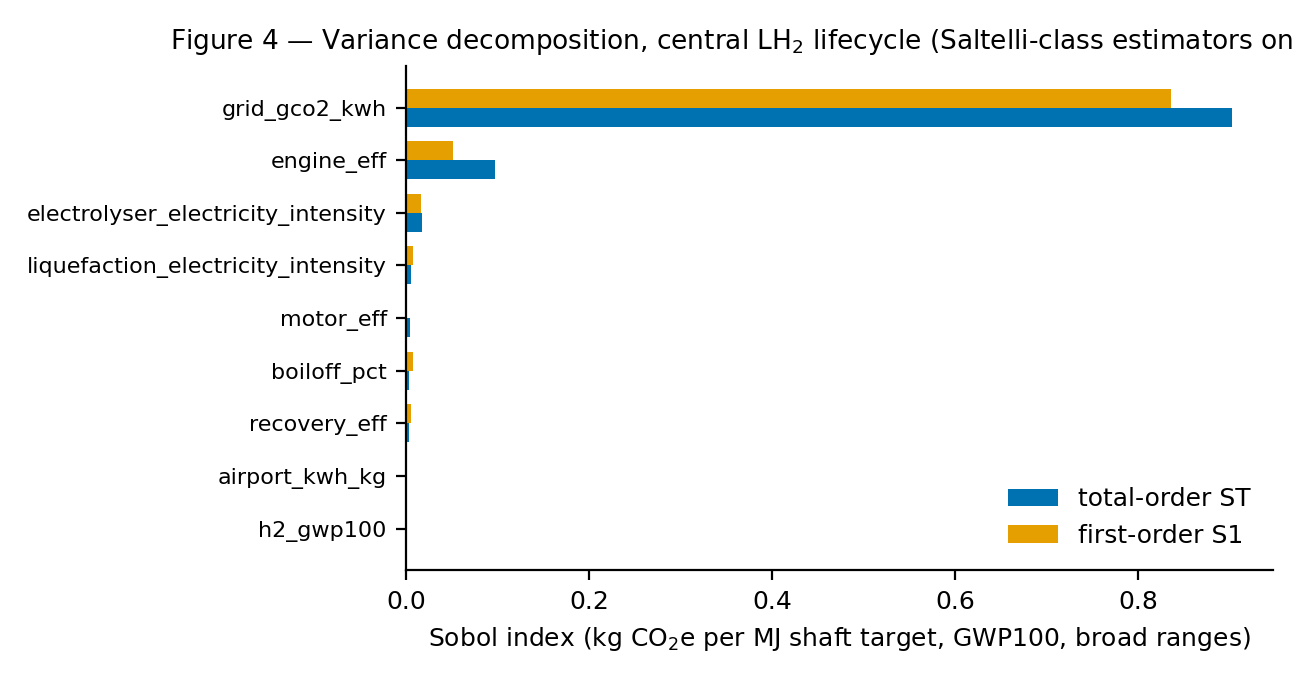
Within the tested parameter ranges, grid carbon intensity is the dominant contributor to lifecycle-output variance on the central LH₂ lifecycle (kg CO₂e/MJ shaft, GWP100, broad ranges): total-order ST 0.901 (S1 0.837), engine efficiency 0.101, electrolyser intensity 0.017 (q17 CSV 0.0170; robustness cross-seed mean 0.0158; audit communication 0.015 — all within the declared ±0.005 tolerance), boil-off 0.003 (grouped-loss alternative 0.007, publishable only if labelled as grouped) (Figure 4; Table 2). The ranking is regime-dependent by computation: boil-off enters the top three only at grid ≤ 10 g/kWh (T1); engine efficiency overtakes grid only at grid ≥ 300 g/kWh on the extended sweep (T3); leakage never leads the e-methane ranking (T2 — a null result kept, not tuned away). The top-two ordering is stable across 3 seeds × two sample sizes × two range sets × both horizons; ST sums include interactions and are not variance shares.
Table 2 — Sobol indices, central LH₂ lifecycle (target kg CO₂e/MJ shaft, GWP100, broad ranges; CSV: tables/table2-sobol.csv)
| Parameter | S1 | ST |
|---|---|---|
| grid_gco2_kwh | 0.8366 | 0.9026 |
| engine_eff | 0.0505 | 0.0966 |
| electrolyser_electricity_intensity | 0.0164 | 0.0170 |
| liquefaction_electricity_intensity | 0.0077 | 0.0055 |
| boiloff_pct | 0.0076 | 0.0034 |
Mechanism-level attribution (HYFLUX MECHANISM MODEL). The principal analysis no longer carries a combined leakage/boil-off line. Per-mechanism rows (register ranges; central-case atmospheric contribution in kg/day @1 t/day): transfer & chill-down — uncertainty rank 1 (2.0-pt swing; atmospheric 0.4; most reducible by MEASUREMENT); venting — rank 2 (1.45; 2.1; measurement); purging — rank 2= (1.45; 2.4; measurement); abnormal — rank 4 (1.0; 2.0; engineering/asset integrity); boil-off — rank 5 (0.96; 1.2; ENGINEERING — best-measured); fugitive — rank 6 (0.95; 3.0; measurement+LDAR). Atmospheric-fate uncertainty and recovery effectiveness enter through the lower/central/upper fate cases. Grid carbon intensity remains dominant after mechanism integration (ST 0.901 structure unchanged): the entire mechanism-vs-parity CI difference (0.86 g CO₂e/MJ delivered, GWP100 central) is small against the 0–250 g/kWh grid span that drives the maps.
5.5 Break-even maps
Question: in which grid/boil-off/leakage regimes does LH₂ beat LCH₄? Method: equal-boundary cell-wise comparison, mechanism-mode hydrogen releases. Result: 15/77/99 of 99 cells at 0.2/2.3/9.4 % methane leakage (e-methane opponent). Interpretation: electricity supply, not fuel identity, decides the regime. Limitations: tested domain only; per-MJ-shaft unit.
Cell definition. Each map is a 9 × 11 grid (grid carbon intensity in 25 g/kWh steps × boil-off multiplier steps, 99 cells); a "cell count" is the number of discrete cells in which one fuel's per-MJ-shaft CI is lower, so counts are threshold crossings on a finite grid and band edges are quoted as ranges for that reason. Model mode: headline maps use the HYFLUX MECHANISM MODEL for hydrogen releases; the historical maps and the Boeing comparison use PARITY / LEGACY (CASCADE-parity track), as labelled per panel. Recomputation under the mechanism-level representation changes delivered-H₂ CI by at most 0.86 g CO₂e/MJ (GWP100 central case — recovery credit net of the unresolved-fate hold), which is below one 25 g/kWh grid-CI cell: cell counts (15/77/99 and 45/54/81 of 99), crossover bands (≈175–200 and 125–150 g/kWh at 2.3 %) and pathway rankings are unchanged; this is a computed bound, not an assertion.
Over the identical boundary (grid 0–250 gCO₂e/kWh × boil-off 0–2× reference, 99 cells, GWP100, slip 0.3 %, η 0.5), LH₂ has the lower lifecycle CO₂e per MJ shaft than the e-methane (DAC-carbon) LCH₄ opponent in 15/99 cells at 0.2 % supply leakage, 77/99 at 2.3 % and 99/99 at 9.4 % (computed; audit-reproduced; Figure 3, top row; Table 3). At 2.3 % the structure is exact and independently verified: methane retains only the corner {grid ≥ 225} ∪ {grid ≥ 200 ∧ boil-off ≥ 1.25×}; the crossover band is ≈175–200 g/kWh. An earlier, much lower crossover figure is withdrawn (CR-V5-015; guard-tested; Appendix A). These counts were previously mislabelled as a fossil-LCH₄ comparison; the opponent is relabelled per an engineering revision (Appendix A)/the horizon-completion revision (Appendix A) (register CR-V5-011…014/031) with no numerical change — RN-1 resolved.
Against the fossil LCH₄ opponent (breakEvenMap(fossil: true); register CR-V5-036/037) the counts are 45/99, 54/99 and 81/99 at the same leakage classes (computed; an engineering revision (Appendix A); Figure 3, bottom row). The two opponents differ for a physical reason: fossil methane carries its combustion CO₂ as a grid-independent floor, so LH₂ wins more low-leakage cells against it; e-methane instead carries synthesis electricity (25 kWh/kg × grid CI), so it loses more dirty-grid cells as the grid worsens. At 2.3 % the fossil-opponent crossover is a clean column transition between grid 125 and 150 g/kWh with no boil-off dependence (band width equal to the map's grid-axis step).
Table 3 — Break-even cell counts (LH₂ versus LCH₄ per claims register, both opponents; GWP100; identical boundary; CSV: tables/table3-breakeven.csv)
| Supply leakage (class) | LH₂-preferred / 99 vs e-methane (DAC) | LH₂-preferred / 99 vs fossil | Structure |
|---|---|---|---|
| 0.2 % (certified-low) | 15 | 45 | LCH₄ leads most of the map against e-methane; fossil floor cedes more cells |
| 2.3 % (US average) | 77 | 54 | e-methane: crossover ≈175–200 g/kWh, dirty-grid corner; fossil: clean 125–150 g/kWh column transition |
| 9.4 % (worst basin) | 99 | 81 | e-methane leads nowhere; fossil keeps the dirtiest-grid columns |
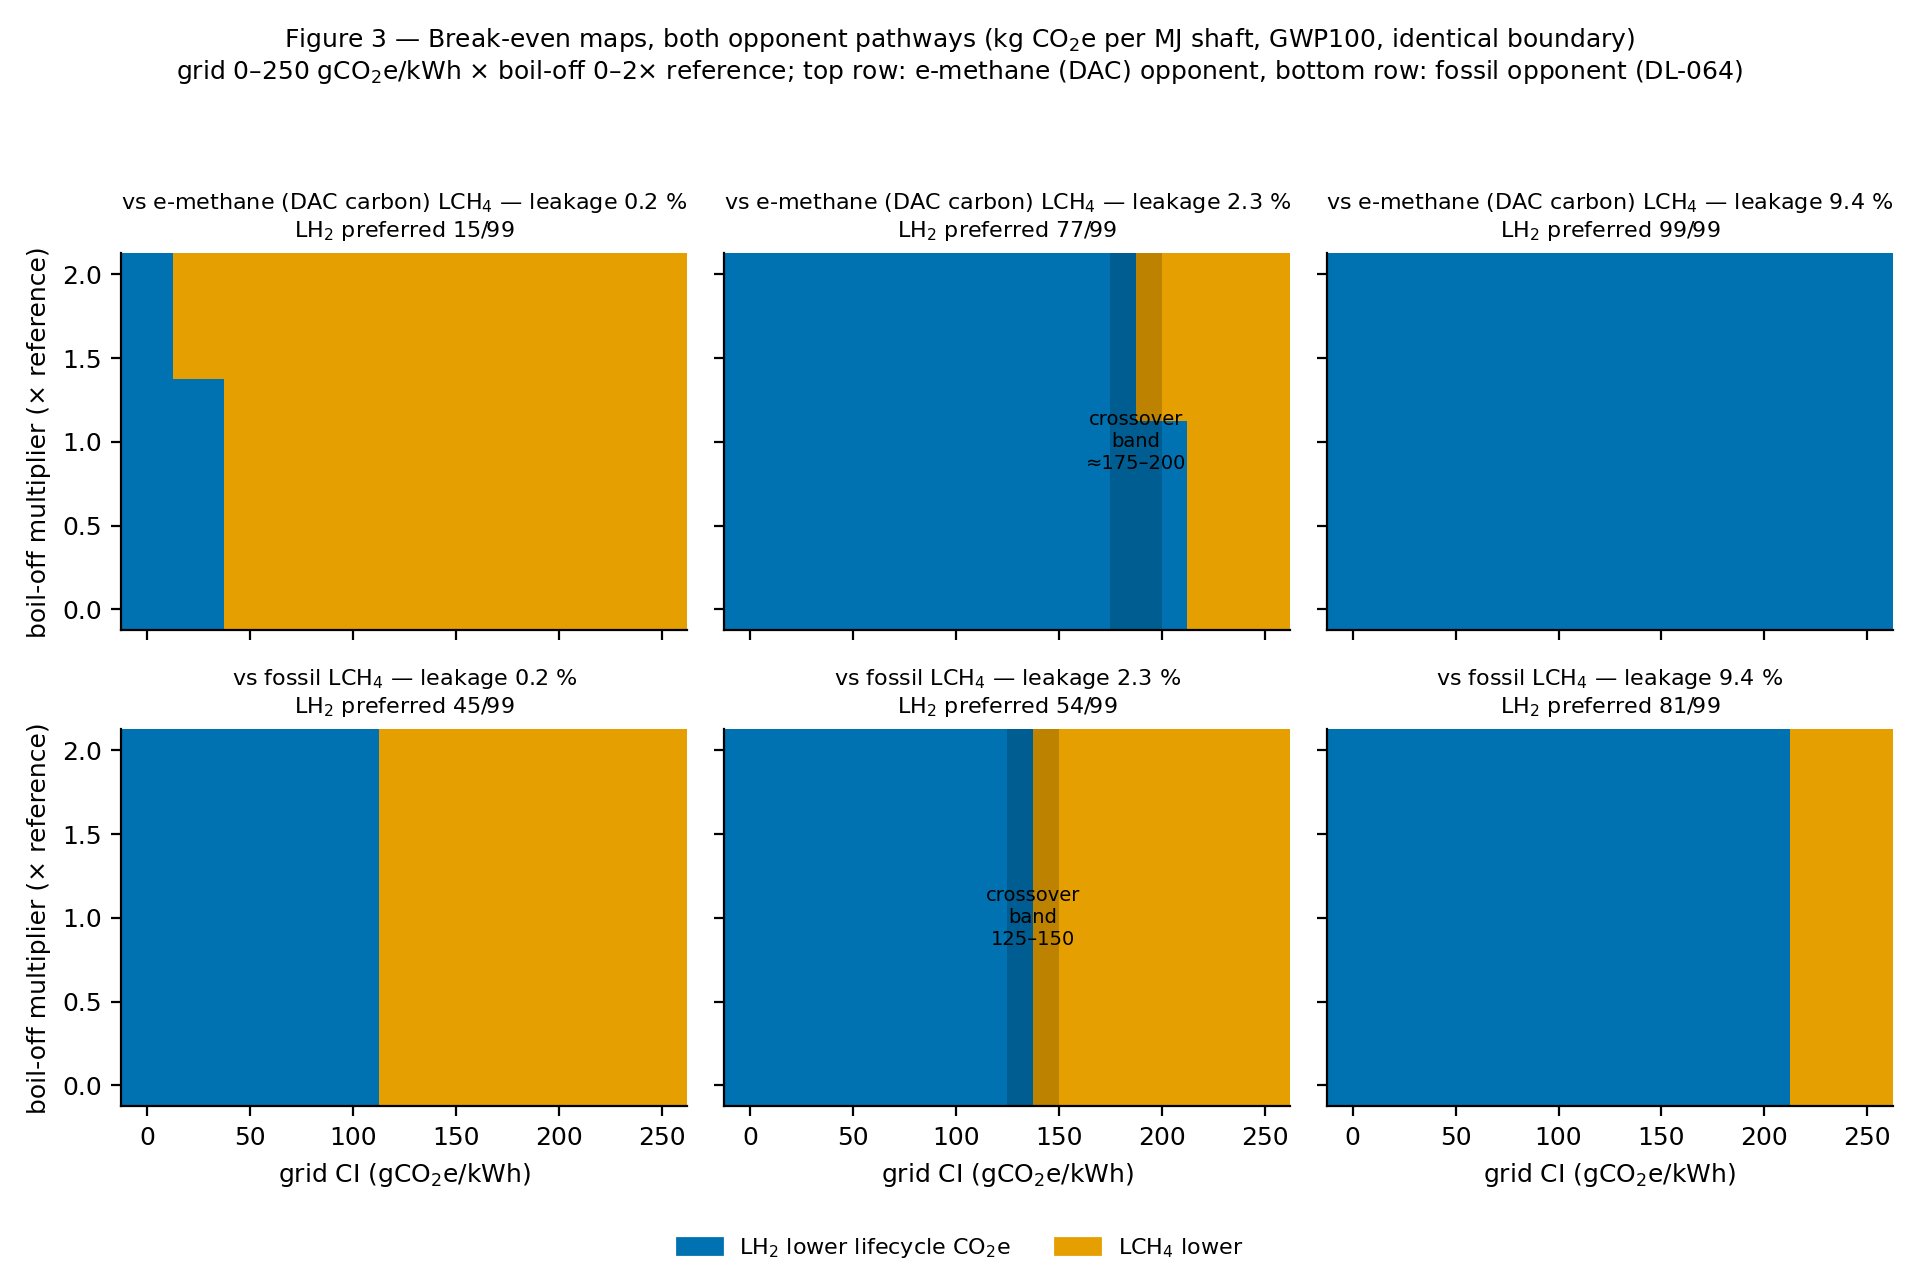
v3-source-audit.md RN-1, resolved); no conclusion extends beyond the tested domain (L8).The hydrogen-only map adjudicates the boil-off proposition per cell: not supported within the tested domain wherever vented warming is under 5 % of lifecycle CO₂e — the entire dirty-grid region.
5.6 Equal-boundary mission totals
At the central boundary (per mission, 5,000 MJ shaft): LH₂ 321 kg CO₂e100 and 342.592 kg CO₂e20; fossil LCH₄ 674 kg CO₂e100 and — after the horizon-completion revision (Appendix A) — 1284 kg CO₂e20 (Figure 6; Table 4), a 1.9× horizon spread for methane. The archived pre-fix 20-year value is held under version-controlled verification (Appendix A).
Table 4 — Mission totals by horizon (kg CO₂e per 5,000 MJ shaft mission; UK 2035, grid 50 g/kWh; passive LH₂ chain, fossil LCH₄; CSV: tables/table4-mission-totals.csv)
| Fuel | GWP100 | GWP20 |
|---|---|---|
| LH₂ | 321 | 342.592 |
| Fossil LCH₄ | 674.413 | 1283.515 |
5.7 Climate-metric bases
Metric convention: GWP is a pulse metric; for sustained emission profiles, flow-based metrics (GWP) would weight short-lived forcing differently. Results are reported on GWP20/GWP100 pulse bases with horizons never mixed; a GWP sensitivity is identified future work rather than silently substituted.
Both horizons are always reported and never mixed within a ledger. v5's CH₄ basis is 29.8 / 80.0 (GWP100/GWP20, AR6 origin-neutral class); the site's 29.88/82.5 is a declared ≈3 % divergence (IPCC, 2021; European Commission, 2026). Hydrogen's indirect warming carries the ensemble of Table 5 — central 11.6 ± 2.8 GWP100 / 37.3 ± 15.1 GWP20, model range 8.0–12.8 — with the OH-bias correction of Yang et al. (2025) pointing ≈20 % lower (provisional direction; leakage size/location sensitivity: ACP 25:4929, 2025). No conclusion flips within the band.
Table 5 — Published H₂ GWP models carried side by side (kg CO₂e/kg H₂; CSV: tables/table5-h2-gwp-models.csv)
| Model | GWP100 | GWP20 |
|---|---|---|
| Sand et al. (2023) — central | 11.6 ± 2.8 | 37.3 ± 15.1 |
| Warwick et al. (2023) | 12 ± 6 | — |
| Hauglustaine et al. (2022) | 12.8 ± 5.2 | — |
| Derwent (2023) | 8 ± 2 | — |
| Yang et al. (2025) — direction | ≈−20 % on central | — |
5.8 CASCADE parity classifications
Findings use only four classifications — REPRODUCED / DIFFERENT REPRESENTATION / DOCUMENTATION AMBIGUITY / UNRESOLVED — with approved wordings in the supplementary materials (Appendix F); no statement implies Boeing's acceptance of any HyFlux interpretation. REPRODUCED: the hydrogen delivered-CI closed form (equation-148 class), replacement/recovery/re-liquefaction structure, two-mode electricity treatment, and liquefaction terms whose published bounds (Al Ghafri et al., 2022: existing plants 12–14 kWh/kg) overlap HyFlux's 10–13. DOCUMENTATION AMBIGUITY: the published CI_loss constant 558 gCO₂e/MJ back-implies CH₄ GWP100 27.9 while the cited AR6 fossil basis yields 596 (intended reading UNRESOLVED on the public record); an explainer's source attribution for the 11.6 value; a communicated worst-case vapour loss of 45.7 % outside the model's published 0–20 % bounds, whose 2 %-expected note (van Ruijven et al., 2011) HyFlux's default matches (Boeing, 2026a, 2026b). DIFFERENT REPRESENTATION: the loss-term formulation (resolved to the single-multiplier reading by Boeing's statement) and loss-aggregation granularity (one f_loss versus ten categories; totals reconcile when summed).
5.9 Uncertainty summary
| Quantity | Central | Range | Evidence | Dominant uncertainty |
|---|---|---|---|---|
| CH₄ supply leakage | 1.6 % (2.3 % US class) | 0.19–9.4 % | measured (basins) | regional class |
| H₂ released, gross | 2.0 % of throughput | mechanism-dependent | estimate | transfer (0–2.0 %) |
| H₂ atmospheric (mechanism) | 11.1 kg/day @1 t/day | 7.8–15 (fate cases) | modelled | fate + recovery fractions |
| Unresolved fate | 1.5 kg/day | 0–2.9 | declared unknown | unmeasured vent/flare/recover split |
| H₂ GWP₁₀₀ | 11.6 | 8.0–12.8 | published ensemble | atmospheric chemistry |
| CH₄ GWP₁₀₀ basis | 29.8 (fossil) / 27.9 | 27.9–29.8 | published | oxidised-CO₂ inclusion |
| Grid CI sensitivity | ST 0.903 | dominant across domain | computed | none material |
| Boil-off (storage) | 0.048–0.1 %/day | measured spheres | measured | dwell profiles |
6. Discussion
Relation to previous work and what is newly understood. Prior fuel-chain assessments represent hydrogen losses as one aggregate fraction: strategic transition models (Boeing CASCADE; IEA scenario analyses), national engineering studies (BEIS/Frazer-Nash 2022, whose ~0.5 %-class production estimates this work adopts as an evidence class), vehicle-cycle models (GREET; JEC Well-to-Wheels, whose boundary conventions the equal-boundary comparison follows), and aviation concept studies (FlyZero, whose FZN-class airframe anchors the aircraft-level closures). The hydrogen-GWP literature (Sand et al. 2023; Warwick et al. 2023; Ocko & Hamburg 2022; Derwent et al. 2020; Royal Society policy assessments) supplies the climate factors but not chain-resolution guidance. The contribution here is resolution: separating six physical release mechanisms with explicit recovery and atmospheric fate shows that an aggregate factor conflates vapour generation with emission and overstates central atmospheric release by ~80 % under identical gross assumptions, while leaving the strategic conclusions (electricity dominance, regime structure) intact. What remains unknown is concentrated and named: the fate of transfer and chill-down releases — which no model resolution can substitute for measurement.
Question this section answers: why does mechanism-level accounting change hydrogen lifecycle assessment, and what does it not change?
6.1 Grid carbon intensity, within the tested space
Grid-CI dominance is a statement about the tested parameter space (grid 0–250 g/kWh on the maps; 0–500 on the sweeps), not a universal law. Low-carbon electricity procurement moves lifecycle outcomes more than any loss-management choice, and decarbonising grids move real systems leftwards across Figure 3 — the dirty-grid corner is transitional, not a stable methane niche.
6.2 Cryogenic infrastructure
Venting is an architecture choice on the boil-off subset (subject to L1), and the measured storage anchors (0.048–0.1 %/day) sit well below the folklore that made boil-off hydrogen's defining problem. The larger hydrogen levers are electrical: liquefaction at 10–13 kWh/kg outweighs boil-off in variance contribution everywhere except near-zero-carbon grids (T1).
6.3 Leakage, certification and the pathway ledger
The 0.2 % row of Table 3 is not a methane endorsement: it states what certified-low supply would achieve if certification held at scale — the certification regime, not the molecule, does the work. Symmetrically, 99/99 is not a hydrogen guarantee; it presumes hydrogen's own chain at modelled loss rates, subject to L1. Fossil methane is never labelled sustainable for beating dirty-grid e-methane: above the B4 threshold (≈135 g/kWh) the comparison indicts the electricity, not the fuel — a rule enforced in code. Bottom-up inventories under-report against top-down measurement (+35 % to +400 %), and the super-emitter tail means the mean leak is not the typical leak (Lauvaux et al., 2022) — hence a map over the full measured leakage range rather than one central value.
6.4 Propulsion and infrastructure
Propulsion efficiency shifts both fuels' curves together (linear in fuel demand by construction): it buys demand and infrastructure reduction, not ranking changes. Methane's one robust infrastructure advantage is the ≈30× liquefaction-electricity asymmetry (0.25–0.35 versus 10–13 kWh/kg) — an energy claim only, while airport-scale LNG operations remain unmeasured (L3).
6.5 Climate metrics
Horizon choice changes methane's case materially (1.9× spread) and hydrogen's modestly; the rule that no GWP100 value may hide inside a GWP20 ledger proved substantive — the horizon-completion revision (Appendix A) moved the methane mission total by 13 %. The hydrogen GWP band (8.0–12.8, direction lower per Yang et al., 2025) is carried, not collapsed.
6.6 Policy: target the correct ledger line
Because leakage, slip, liquefaction electricity and combustion sit on separate ledger lines, policy levers map cleanly: supply leakage responds to certification and infrastructure standards; slip to engine technology; liquefaction and synthesis to electricity procurement. Blending the lines misdirects all three levers.
6.7 Effect of Mechanism-Level Accounting
Atmospheric release decreased (20.0 → 11.1 kg/day) because recovery, return-to-stock and beneficial use are now credited mechanism-by-mechanism instead of being embedded in one aggregate loss factor; replacement production decreased for the same reason — recovered hydrogen no longer demands replacement. This is more physically representative, and it is not new measurement evidence: no release rate changed, only the accounting resolution. Greater accounting resolution changed the central estimate while preserving the broader regime structure — demonstrating that recovery and atmospheric fate must be represented explicitly rather than embedded in an aggregate loss factor. Transfer & chill-down now dominates uncertainty; its vent/flare/recover split is the measurement that would most reduce it, with boil-off best addressed through engineering. The engineering recommendation is unchanged: decarbonised electricity first, measured releases second, architecture third.
6.8 CASCADE comparison
Where HyFlux and CASCADE central values differ, this report does not adjudicate; it states both readings and classifies each difference under the four classifications of §5.8 only. Both models agree on the liquefaction asymmetry and on grid-CI dominance for electro-fuels. The audit wounded both models — one MAJOR and six further defects on the HyFlux side (Appendix A) — and no public use of the parity findings is approved without that symmetry statement.
7. Limitations
Question this section answers: which parts of this analysis rest on estimates or scenarios rather than measurement, and how would each be closed?
The full per-item register with severities and closure triggers is the supplementary materials (Appendix F) (L1–L14); here classified under a four-way uncertainty taxonomy with measurement-reducibility stated:
- Evidence limitations (reducible by measurement). Transfer/chill-down/purge loss fate — the historical aggregate 72.44 kg/day generated-loss figure has no measured vent/flare/capture split; under the mechanism ledger this appears as the 1.5 kg/day unresolved-fate hold plus transfer's fate fractions, and all legacy venting ratios remain fate-conditional between 15.40× and ≈1.11× (historical aggregate sensitivity; L1, MAJOR). Aircraft-tank boil-off (L2), airport LNG operations (L3) and aviation methane slip (marine analogue 0.1–3.5 %; L4): no public measurements. Each closes with a named campaign; these are the highest-value measurements the field could fund.
- Model limitations — parameter (reducible partly by measurement, partly by ensemble assimilation). H₂ GWP spread 8.0–12.8, post-2023 evidence favouring the lower half (L6); leakage class centrals and the super-emitter tail shape (L11); class-value energies — e-methane synthesis 25 kWh/kg, electrolysis 45–60, liquefaction 6–15 kWh/kg plant classes (L9, L10).
- Scenario limitations (explicit choices, not measurement-reducible). Grid-CI values and trajectories; vapour-management adoption; the tested domain itself — grid 0–250 g/kWh × boil-off 0–2× reference, beyond which no conclusion extends, and "falsified" always means falsified-within-tested-domain (L8); metric-basis selection (L5).
- Scope and model-form limitations (changes require re-modelling). Fixed per-fuel propulsion architectures 0.465/0.45 (L13); single-airport 1,000 kg/day scale (L14); exclusion of contrails and non-CO₂ flight effects from this layer (L12); estimator finite-sample behaviour, declared not hidden (L7).
8. Conclusions
- Mechanism-level hydrogen accounting (six release mechanisms with explicit recovery, fate and replacement) is now the principal HyFlux representation.
- Central modelled atmospheric hydrogen release is 11.1 kg/day per 1,000 kg/day delivered.
- Unresolved fate is 1.5 kg/day (transfer & chill-down), held visible and bounded by the upper fate case.
- Replacement production is 12.7 kg/day; recovered hydrogen is excluded from replacement demand.
- The legacy aggregate mode reports 20.0 kg/day and remains available solely as PARITY / LEGACY for historical and Boeing CASCADE comparison.
- Transfer-related operations remain the highest-value physical measurement priority in aviation hydrogen; the historical 72.44 kg/day figure is the aggregate generated-loss output, now decomposed with recovery credited (Appendix E).
- Grid carbon intensity remains the dominant lifecycle lever within the tested domain (Sobol ST 0.901); break-even cell counts and crossover bands are unchanged under the mechanism-level representation (computed bound 0.86 g CO₂e/MJ).
- The mechanism integration is a methodological revision verified by independent reconstruction; it does not constitute physical validation.
- No universal methane-versus-hydrogen winner is supported; the result remains a regime map conditioned on grid carbon intensity and certified leakage.
- Decision grade remains false: Tier-1 screening, physical validation partial, external peer review not completed.
9. Reproducibility statement
The results in this article were produced with model hyflux-lca-v5 (calculation engine 5.0.0-dl085) against Evidence Register v1.4.0; both are version-stamped into every export together with the generation timestamp. All computations are deterministic (deterministic sampling), and every figure and table regenerates from versioned inputs. Data provenance: each input parameter carries source, publication year, geography, measurement basis, evidence type (eight-class controlled vocabulary), confidence, technology-readiness level and review status in the canonical Evidence Register, from which the model defaults, the evidence appendix and the machine-readable dataset (CSV) are generated. Software verification comprises an automated regression suite covering mass balance, dimensional consistency, frozen-parity pins and metadata-drift detection; the count and date of passing tests are recorded in the canonical build manifest. The mechanism-ledger accounting was additionally reconstructed by an independent implementation in a second language operating on the Evidence Register alone, with agreement to ten decimal places; this establishes implementation consistency, not physical validity. Limitations: the source code is privately maintained and results are reproducible internally from the versioned repository; externally, published evidence classifications, equations and downloadable datasets permit inspection and recalculation of the principal results, and repository access for external review is available on request. No representative operating hydrogen airport chain currently validates the complete mechanism-led release result. Future availability: a citable archived release (DOI) is planned to accompany external peer review.
10. References
Categories: [P] peer-reviewed literature · [G] government/intergovernmental · [I] industry technical documentation · [H] HyFlux internal model and verification records (internal, not peer-reviewed external evidence). Bibliographic metadata gate for HEADLINE-SUPPORTING references: CLOSED 2026-07-24 — Sand et al. locator verified against the publisher (4, 203 (2023), doi:10.1038/s43247-023-00857-8); DOIs and locators resolved for Alvarez 2018, Lauvaux 2022, Bakkaloglu 2022, Warwick 2023, Zhang 2020, Riddick 2019, Ocko & Hamburg 2022, Bertagni 2022, Derwent 2020, Hauglustaine 2022, Al Ghafri 2022. Mutable Boeing CASCADE and docs pages carry access dates (19–24 July 2026) and are mirrored in the repository. Nine non-headline entries retain a completion flag (Appendix B). Reference confidence: High for headline-supporting entries; Medium overall until the residual flags clear.
Al Ghafri, S.Z.S. et al. (2022) 'Hydrogen liquefaction: a review of the fundamental physics, engineering practice and future opportunities', Energy & Environmental Science, 15(7), pp. 2690–2731. doi:10.1039/D2EE00099G.
Alvarez, R.A. et al. (2018) 'Assessment of methane emissions from the U.S. oil and gas supply chain', Science, 361(6398), pp. 186–188. doi:10.1126/science.aar7204.
Atmospheric Chemistry and Physics (2025) hydrogen leakage size/location sensitivity study, Atmospheric Chemistry and Physics, 25, p. 4929 [metadata completion pending — non-headline supporting; tracked in Appendix B: authors, title, DOI].
Bakkaloglu, S., Cooper, J. and Hawkes, A. (2022) 'Methane emissions along biomethane and biogas supply chains are underestimated', One Earth, 5(6), pp. 724–736. doi:10.1016/j.oneear.2022.05.012.
Bakkaloglu, S. et al. (2022) biomethane supply-chain emissions assessment, One Earth [metadata completion pending — non-headline supporting; tracked in Appendix B: title, volume, pages].
Boeing (2026a) CASCADE Climate Impact Model documentation: hydrogen energy equations (137–148) and parameter bounds. Available at: docs.cascade.boeing.com (Accessed: 19 July 2026; mutable web source).
Boeing (2026b) CASCADE fugitive-emissions explainer and methane news articles. Available at: cascade.boeing.com (Accessed: July 2026; mutable web source).
Chen, Y. et al. (2022) aerial-survey quantification of Permian Basin methane emissions, Environmental Science & Technology, 56 [metadata completion pending — non-headline supporting; tracked in Appendix B: title, pages, DOI].
Chen, Z. et al. (2023) upstream methane intensity of Middle East production (Qatar-class), Atmospheric Chemistry and Physics, 23 [metadata completion pending — non-headline supporting; tracked in Appendix B: title, pages, DOI].
Derwent, R.G. et al. (2020) 'Global modelling studies of hydrogen and its isotopomers using STOCHEM-CRI: likely radiative forcing consequences of a future hydrogen economy', International Journal of Hydrogen Energy, 45(15), pp. 9211–9221. doi:10.1016/j.ijhydene.2020.01.125.
European Commission (2026) Methane emissions [webpage]. (Accessed: 19 July 2026; mutable web source).
Fesmire, J.E. et al. (2021) Liquid hydrogen storage sphere boil-off performance. NASA NTRS 20210018309 [metadata completion pending — non-headline supporting; tracked in Appendix B: exact title].
Hauglustaine, D. et al. (2022) 'Climate benefit of a future hydrogen economy', Communications Earth & Environment, 3, 295. doi:10.1038/s43247-022-00626-z.
IPCC (2021) Climate Change 2021: The Physical Science Basis. Sixth Assessment Report, Working Group I. Cambridge: Cambridge University Press.
Lauvaux, T. et al. (2022) 'Global assessment of oil and gas methane ultra-emitters', Science, 375(6580), pp. 557–561. doi:10.1126/science.abj4351.
Notardonato, W.U. et al. (2017; 2018) Ground operations demonstration unit for liquid hydrogen: zero-boil-off results. NASA NTRS 20170006481 and 20180006814 [metadata completion pending — non-headline supporting; tracked in Appendix B: exact titles].
Riddick, S.N. et al. (2019) 'Measuring methane emissions from oil and gas platforms in the North Sea', Atmospheric Chemistry and Physics, 19(15), pp. 9787–9796. doi:10.5194/acp-19-9787-2019.
Sand, M. et al. (2023) 'A multi-model assessment of the global warming potential of hydrogen', Communications Earth & Environment, 4, 203. doi:10.1038/s43247-023-00857-8. [locator verified 2026-07-24]
van Ruijven, B. et al. (2011) hydrogen chain loss estimates, Global Environmental Change, 21, pp. 983–994 [metadata completion pending — non-headline supporting; tracked in Appendix B: title, DOI].
Warwick, N.J. et al. (2023) 'Atmospheric composition and climate impacts of a future hydrogen economy', Atmospheric Chemistry and Physics, 23(20), pp. 13451–13467. doi:10.5194/acp-23-13451-2023.
Yang, H. et al. (2025) model OH-bias correction of hydrogen GWP, Geophysical Research Letters. doi: 10.1029/2024GL112445 [metadata completion pending — non-headline supporting; tracked in Appendix B: title].
Zhang, Y. et al. (2020) 'Quantifying methane emissions from the largest oil-producing basin in the United States from space', Science Advances, 6(17), eaaz5120. doi:10.1126/sciadv.aaz5120.
11. Methane Losses and Hydrogen Released: Evidence, Uncertainty and Future Improvement
This section documents the evidence base behind every leakage assumption in the model, including the year-by-year improvement trajectories (engine module leakage-trajectory.ts); the paper and the model use identical values, terminology, units and boundaries by construction (both are generated from the same registers).
11.1 Terminology and release mechanisms
"Emissions" is used as the broad term. The model and this paper distinguish: fugitive leakage (seals, valves, joints, compressors, pipelines); deliberate venting and operational purging; pressure-relief releases; methane slip from incomplete combustion or flaring; hydrogen boil-off from liquid storage and transfer; maintenance and commissioning releases; accidental or abnormal high-emission events; and permeation/diffusion through materials. In v1 of the trajectory machinery a single trajectory applies to each fuel's aggregate loss fraction; the mechanism split is carried as a labelled display decomposition (CH₄: fugitive 60 %, venting/purging 25 %, boil-off/pressure 5 %, unplanned 10 %; H₂: 15/30/45/10 % — class estimates, declared), with per-mechanism trajectories a stated v2 item.
11.2 System boundaries and denominators
Emissions are assessed against the eight-stage chain: feedstock extraction; processing/production; compression or liquefaction; storage; pipeline/ship/road transport; distribution and terminals; refuelling/dispensing; onboard storage and use. Every percentage in the model is expressed as mass lost relative to gross production entering the chain (the "% of production" denominator of Table 1) unless a stage-specific basis is stated; delivered-basis figures are always derived through the replacement identity of §11.7, never quoted interchangeably. Values with inconsistent denominators are never compared.
11.3 Methane evidence review
The measured record is extensive and diverging from inventories: the IEA Global Methane Tracker (2025) places fossil-sector methane above 120 Mt/yr — roughly 80 % higher than nationally reported totals — because most reporting uses emission factors rather than measurement (IEA, 2025). Inventory factors, source-level measurements, facility-level campaigns, and aerial/satellite observation form a hierarchy in which each wider lens has historically found more methane than the narrower one; UNEP's IMEO and the OGMP 2.0 reporting framework exist precisely to reconcile these levels. Super-emitters are intermittent and heavy-tailed (8–12 % of oil-and-gas methane; Lauvaux et al., 2022), so the mean leak is not the typical leak, and the model samples a lognormal body with a Pareto tail rather than a single factor. The model therefore carries measured classes, not one universal value (Table 1: 0.19 % UK offshore to 9.4 % worst-basin aerial, with the 2.3 % US-average central), and the same classes bound blue-hydrogen upstream methane where reforming pathways are engaged.
11.4 Hydrogen evidence review
Hydrogen emissions evidence is component-level and mostly non-measured: electrolyser crossover and purge losses, reformer separation, compressor seals, geological and vessel storage, pipelines, tube trailers, liquefaction, cryogenic tanks, transfer/refuelling, and end-use systems each carry estimates derived from engineering calculation, safety analysis, or analogy rather than atmospheric mass balance. The UK BEIS/Frazer-Nash study (2022) — the model's basis class for chain losses — derives ~0.5 %-class production losses and per-stage envelopes from engineering assessment, explicitly noting that hydrogen systems have historically been monitored for safety and product loss, not environmental mass balance: small outdoor releases below flammability thresholds pass undetected by conventional sensors. The model's 2 % central chain value matches the published bounds-page interpretation ("expected vapor loss if no leakage occurs", van Ruijven et al., 2011-basis) and is labelled published-not-measured; the historical aggregate 72.44 kg/day transfer/chill-down/purge generated-loss figure (now decomposed, with the mechanism ledger holding 1.5 kg/day as explicitly unresolved fate) remains the dominant epistemic gap (L1). Volume, mass and energy percentages are not interchangeable for hydrogen: a given volumetric loss corresponds to roughly an order of magnitude less mass than the same volumetric loss of methane. For this reason the model does not use the often-repeated "hydrogen leaks about three times faster than methane" as a mass-loss assumption: that factor describes particular hole geometries and flow regimes in volumetric terms, and the BEIS/Frazer-Nash analysis notes that higher volumetric leakage does not translate directly into higher mass leakage. All model hydrogen percentages are mass-basis and stage-attributed.
11.5 Atmospheric and climate effects
Methane is a direct greenhouse gas; hydrogen is an indirect climate forcer that depletes tropospheric hydroxyl (extending methane lifetime) and perturbs tropospheric ozone and stratospheric water vapour (Ocko and Hamburg, 2022; Warwick et al., 2023; Bertagni et al., 2022). The model's bases are stated in §3.4/§5.7 and unchanged here: CH₄ at AR6 GWP100 29.8 / GWP20 80.0 (origin-neutral class; the fossil-specific 82.5 divergence declared); H₂ at 11.6 ± 2.8 GWP100 / 37.3 ± 15.1 GWP20 (Sand et al., 2023 ensemble; model range 8.0–12.8 with post-2023 evidence direction lower, Yang et al., 2025). Both horizons are always reported and never mixed. Hydrogen's impact is not equivalent to methane's: the mechanisms, lifetimes and uncertainty structures differ, and the model keeps them on separate ledgers.
11.6 Technology-improvement evidence and maturity labels
Methane reductions rest on demonstrated technology: LDAR programmes, continuous monitoring, satellite/aerial detection, zero-bleed pneumatics, improved compressor seals, vapour recovery, venting replacement, improved flare operation, predictive maintenance and asset renewal — the OGMP 2.0/IEA abatement portfolio, much of it operating today (demonstrated to best-available maturity). Hydrogen reductions rest on hydrogen-specific low-level sensors, mass-balance monitoring, welded joints, closed-loop purging, compressor-loss and boil-off recovery/re-liquefaction, improved cryogenic insulation, automated isolation, hydrogen-compatible materials and risk-based inspection — mostly best-available-to-research maturity, with no operating LH₂-airport demonstration. The model's presets separate these maturities explicitly: roadmap trajectories are labelled TARGET throughout and are never presented as demonstrated performance.
11.7 Annual trajectories in the model
Four scenario families are implemented per fuel, applied from base year 2024 with a 2050 horizon: no improvement (constant — the default, reproducing the prior fixed-value model numerically identically); conservative (compound reduction from normal asset replacement: CH₄ 2 %/yr, H₂ 1 %/yr); central (monitoring/repair/recovery adoption: CH₄ 6 %/yr, H₂ 4 %/yr); accelerated (strong regulation and best-available deployment: CH₄ 12 %/yr, H₂ 8 %/yr) — plus linear-to-target and user-defined modes. Starting rates are the model's class centrals (CH₄ 1.6 % of production; H₂ 2 % chain loss). No trajectory may fall below the floors: CH₄ 0.2 % (the best MEASURED supply class, Chen et al., 2023) and H₂ 0.5 % (declared scenario floor — transfer flash is not eliminable and no measured chain exists). Geography and infrastructure applicability follow the class definitions of Table 1; confidence is low-to-medium by construction (targets), and the interface exposes every parameter for replacement with project-specific measured data. The replacement identity is preserved at every annual rate: production scales by 1/(1−f) so delivered fuel is mass-balanced and replacement-fuel upstream emissions are charged (independently verified to 8 decimal places).
11.8 Interpretation: thresholds, not winners
Neither gas's leakage behaviour makes a pathway universally preferable. The rankings move at computed thresholds, unchanged from §5.5: the LH₂/e-methane crossover band at 2.3 % supply leakage sits at ≈175–200 gCO₂e/kWh grid CI (fossil opponent 125–150); methane's short-horizon case collapses first as leakage rises (GWP20 break-evens 0.9–1.4 %); and declining-leakage trajectories shift these thresholds year by year in the direction of the improving fuel. Comparisons are made on delivered fuel with replacement-fuel emissions charged, at declared grid carbon intensity, on both climate horizons.
11.9 Conclusions on the leakage evidence
Methane emissions are better characterised than hydrogen's but remain underestimated wherever measurement is incomplete (the reported-vs-measured gap is a factor, not a rounding error). Hydrogen leakage evidence is emerging and highly uncertain, with monitoring historically aimed at safety rather than mass balance. Both gases require measurement-based monitoring rather than assumed fixed factors; leakage should improve as detection, containment, recovery and operating practice mature, but such improvement must be modelled transparently — as labelled trajectories with floors and evidence status — and never assumed without evidence. The model permits users to replace every default trajectory with measured project-specific data.
11.10 Hydrogen released — six independent mechanisms (DL-087)
From v1.3.0 of the evidence register, "hydrogen leakage" is retired as an aggregate: hydrogen released from the fuel chain is modelled as six independent mechanisms, each with its own register entry, evidence type, uncertainty, TRL and mechanism-specific technology trajectory. Leakage is only the fugitive subset.
| Mechanism | Register ID | Central (% chain) | Range | Evidence type | Technology (acts on this mechanism only) |
|---|---|---|---|---|---|
| Fugitive leakage | H2_REL_FUGITIVE | 0.30 | 0.05–1.0 | engineering estimate | LDAR, seals, welded joints, predictive maintenance |
| Planned venting | H2_REL_VENTING | 0.30 | 0.05–1.5 | engineering estimate | recovery systems, closed-loop venting, recombiners |
| Purging | H2_REL_PURGING | 0.30 | 0.05–1.5 | engineering estimate | H₂ recovery, gas recycling, reduced purge volumes |
| Cryogenic boil-off | H2_REL_BOILOFF | 0.60 | 0.24–1.2 | direct measurement (stationary spheres) | insulation, cryocoolers, reliquefaction, vapour recovery |
| Transfer & chill-down | H2_REL_TRANSFER | 0.30 | 0.0–2.0 | engineering estimate, fate unmeasured | transfer protocols, recovery vessels, automated coupling |
| Abnormal releases | H2_REL_ABNORMAL | 0.20 | 0.0–1.0 | scenario (frequency class) | none routine — excluded from improvement trajectories |
The six centrals sum to exactly 2.0 % — the frozen aggregate default — so all parity results are numerically identical (independently verified). Technology adoption is mechanism-specific: no global CAGR is applied.
Per-mechanism sensitivity (do not assume boil-off dominates). One-at-a-time
swings across register ranges rank transfer & chill-down first (2.0-point
swing — its atmospheric fate is unmeasured), abnormal and venting/purging next,
boil-off only fourth (it is the best-measured mechanism, hence the narrowest
band). Lifecycle climate impact scales each swing by CI_H₂,lost (96.7 g CO₂e/MJ
GWP₁₀₀; ~308 GWP₂₀): the transfer range alone spans 0–1.9 g CO₂e/MJ (GWP₁₀₀)
on the delivered-H₂ CI. The model-derived 72.44 kg/day figure (1,000 kg/day throughput; aggregates transfer, chill-down and purge; NOT a measured airport-chain rate) is fully decomposed
(chill-down 28.9, flash 21.7, purge 14.5, disconnect 7.3; mass balance and
Sankey) in phase0-discovery/H2-Transfer-Loss-Decomposition.md; its
vent/flare/recover split remains the single most valuable measurement aviation
hydrogen could commission.
11.11 Mechanism-Level Hydrogen Release Accounting (methods and results)
Methods. Three calculation modes: aggregate parity (PARITY/LEGACY — the frozen 2.0 % chain default, no fate inference, retained for regression and CASCADE comparison; never the preferred representation), the HYFLUX MECHANISM MODEL (principal), and project-data (measured site values; provenance, date, boundary and denominator mandatory; outputs stamped project-specific). Ledger identity per mechanism and year: gross generated = recovered + returned + atmospheric + unresolved; atmospheric = (gross − unresolved) × fate-fraction × (1 − recovery). Replacement production is charged only on out-of-boundary mass (atmospheric + unresolved) — recovered, returned and re-liquefied hydrogen stays inside the system boundary and is never charged replacement (no blind 1/(1−f) over gross). Fate statuses use an eight-value controlled set; unresolved fate is never silently zeroed or vented — headline results carry lower/central/upper fate cases. All fate, recovery and unresolved fractions live in the evidence register (v1.4.0); a source-scan test forbids constants outside it.
Results (central fate case, base year, 1,000 kg/day delivered). Aggregate parity (PARITY / LEGACY): 20.0 kg/day atmospheric (all gross vented by definition); the mechanism-level representation (legacy-equal gross by construction): 20.0 kg/day gross vapour → 3.1 recovered, 11.1 atmospheric, 1.5 unresolved (transfer fate, visible), replacement 12.7 kg/day versus the blind 20.4. Sensitivity by explicit mechanism rows: transfer & chill-down ranks first (2.0-point register swing; most reducible by measurement); boil-off — the best-measured mechanism — is most reducible by engineering. Robustness: grid carbon intensity remains the dominant lifecycle driver; mechanism integration redistributes the hydrogen-release term without changing the Sobol structure. Verification. The ledger was independently reconstructed in Python from the register alone (the supplementary materials (Appendix F)) and agrees with the TypeScript engine to ten decimal places on every row and total (verified). Phase 3 of the readiness roadmap is complete: the mechanism-level representation is integrated into headline results, independently reconstructed, and parity remains numerically identical.
12. CASCADE cross-validation, Boeing feedback and positioning (added 2026-07-24, DL-084)
12.1 Methane GWP basis — documentation comparison (F1)
Boeing's July 2026 documentation and accompanying explainer appear to use different descriptions for the methane GWP₁₀₀ basis associated with the published loss carbon-intensity constant. The explainer (2026-07-15, modified 2026-07-23) cites 27.9 (Smith et al., AR6 WG1 Supplementary Material), which reproduces CI_CH₄,loss = 558 g CO₂e/MJ exactly (27.9 × 1000/50); the technical documentation describes 558 as "based on a GWP100 of 29.8" (which would give 596) with a reference to Sand et al. 2023. Whether the oxidised-CO₂ contribution of fossil-origin methane is included (29.8 → 596, +6.8 %) is a documented methodological question that warrants clarification rather than an error on either side. HyFlux therefore retains both interpretations within the Evidence Register (558 parity / 596 independent) and reports the sensitivity associated with each. Independent correspondence (July 2026) confirms this reading and sharpens it: because CI_CH₄,loss is presented as a standalone constant while the surrounding derivation also refers to f_loss, an independent implementer could (a) treat the constant as already containing f_loss and multiply by f_loss again — an f² error understating the warming term roughly 60-fold at 1.6 % loss; (b) apply the 1/(1−f) make-up factor to the leakage term as well as production — double-charging replacement; or (c) commit both errors, which partially cancel and can pass simple spot checks. The hydrogen documentation avoids this because 96.7 = 11.6 × 1000/120 is visibly a pure constant with f_loss appearing exactly once. This model's declaration, for the avoidance of the same ambiguity: CI_CH₄,loss is a constant independent of f_loss (GWP × 1000/LHV); the loss fraction multiplies it exactly once, and the make-up factor applies to production only — the structure verified by the mass-balance identity test and by single-multiplier reproduction of the published fossil (≈68) and biomethane (≈22 g CO₂e/MJ) carbon intensities.
12.2 Boeing's published present-system scenario estimates adopted
The same explainer publishes chain-loss anchors — LCH₄ 1.6 % today / 12 %
worst case; LH₂ 12.3 % today / 45.7 % worst case — now carried in the
register as CH4_CHAIN_LOSS_TODAY and H2_CHAIN_LOSS_TODAY (PROVISIONAL,
secondary synthesis). Two observations: (a) 45.7 % is the bound identified
independently in our evidence-gap analysis; (b) Boeing's present-system scenario estimate for LH₂
(12.3 %) is six times the 2 % "expected vapor loss if no leakage occurs" design
value used as the model default — reinforcing this paper's position that H₂
chain losses must be carried as trajectories with declared floors, not constants.
CASCADE's docs also state that gaseous-system H₂ leaks "are not modeled"
(assumed manageable by passive controls), and its fossil-methane CI (docs
eq 165) carries no 1/(1−f) replacement term, unlike the biogenic form (eq 166).
12.3 Constructive feedback offered to Boeing
Five questions accompany this review (full text in the DL-084 technical review): regional/time-resolved/user-configurable CH₄ leakage; explicit H₂ fugitive scope including venting, purging and boil-off provenance; dynamic (year-resolved) carbon intensities for bio pathways; a published evidence register with source, confidence and uncertainty per constant; and exposed output uncertainty bands. The tone is collaborative: CASCADE is the reference strategic model for aviation decarbonisation, and this model deliberately consumes its constants as a frozen parity track.
12.4 Positioning
CASCADE is a strategic transition and demand model (fleet, traffic, strategy
sliders, MACC costing of energy-related opex with capital amortised into unit
costs). HyFlux-LCA is an engineering-grade lifecycle platform: per-pathway
WtWa accounting with measured/estimated/target evidence classes, year-resolved
leakage trajectories, cryogenic thermal and superconducting-propulsion system
models, aircraft geometry closure (OpenVSP/VSPAERO), airport-level operations
calibrated on Cirium data, and evidence-gated AI optimisation. The two are
complementary: CASCADE sets the strategic context; HyFlux validates the per-MJ
physics and engineering feasibility inside it. Scenario crosswalk and gap
analysis: phase0-discovery/CASCADE-HyFlux-Technical-Review.md and
cascade-hyflux-scenario-crosswalk.csv.
Appendix C — Leakage evidence table (every model default traceable)
C.1 Canonical evidence register (generated from data/evidence/evidence-register.json v1.5.1 — the single source of truth for the engine, UI and this paper; the table below is regenerated at build time and cannot drift)
| ID | Gas | Stage | Range (min–max) | Central | Unit | Type | Status | Confidence | Key references |
|---|---|---|---|---|---|---|---|---|---|
| CH4_UPSTREAM_LEAKAGE | Methane | Full supply chain | 0.19–9.4 | 1.6 | % of gross production | measured classes (engine central is the RST-parity default) | current operations | high (classes) / medium (central) | Alvarez et al. 2018 Science 361:186; Riddick et al. 2019 ACP 19 … |
| CH4_LEAK_FLOOR | Methane | Upstream | 0.1–0.3 | 0.2 | % of production | measured | demonstrated | high | Chen et al. 2023 ACP 23 |
| CH4_CI_LOSS | Methane | Atmosphere | 558–596 | 558 | gCO2e per MJ of lost fuel | published (parity value) | n/a | medium (F1 open) | Boeing CASCADE methane docs (2026, access-dated); IPCC AR6 2021 … |
| H2_CHAIN_VAPOR_LOSS | Hydrogen | Delivery chain | 0–20 | 2 | % of chain throughput | published engineering estimate | current design | medium | van Ruijven et al. 2011 Global Env Change 21:983-994; Boeing parameter-bounds page (2026, access-dated) … |
| H2_LEAK_FLOOR | Hydrogen | Production/chain | 0.25–1.0 | 0.5 | % of chain mass | engineering assessment (declared scenario floor) | assessed | low-medium | BEIS/Frazer-Nash 2022 Fugitive Hydrogen Emissions in a Future Hydrogen Economy; Fan et al. 2022 |
| H2_STORAGE_BOILOFF | Hydrogen | Storage | 0.048–0.1 | 0.074 | %/day of stored mass | measured | demonstrated | high | Fesmire et al. 2021 NASA NTRS 20210018309; Notardonato et al. 2017/2018 (ZBO 390 W @ 20 K) |
| GWP_CH4_100 | Methane | Atmosphere | 27.9–29.8 | 29.8 | kgCO2e/kg | published | n/a | high | IPCC AR6 2021 |
| GWP_CH4_20 | Methane | Atmosphere | 77.24–82.5 | 80.0 | kgCO2e/kg | published | n/a | high | IPCC AR6 2021; European Commission methane page 2026 (82.5 variant) |
| GWP_H2_100 | Hydrogen | Atmosphere | 8.0–12.8 | 11.6 | kgCO2e/kg | published ensemble | n/a | medium | Sand et al. 2023 Comm Earth Env 4; Warwick et al. 2023 ACP 23 … |
| GWP_H2_20 | Hydrogen | Atmosphere | 22.2–52.4 | 37.3 | kgCO2e/kg | published ensemble | n/a | medium | Sand et al. 2023 Comm Earth Env 4 |
| TRAJ_CH4_CAGR | Methane | All | 2.0–12.0 | 6.0 | %/yr compound reduction of loss rate | TARGET (technology roadmap) | announced targets | low (targets) | OGMP 2.0 framework; IEA Global Methane Tracker 2025 abatement chapter … |
| TRAJ_H2_CAGR | Hydrogen | All | 1.0–8.0 | 4.0 | %/yr compound reduction of loss rate | TARGET (technology roadmap) | aspirational-to-announced | low (targets) | BEIS/Frazer-Nash 2022; US DOE H2 Emissions Workshop … |
| LOSS_SPLIT_CH4 | Methane | All | 0–1 | 0.6 | share of aggregate loss | estimated | n/a | low | IEA Global Methane Tracker mechanism chapters |
| LOSS_SPLIT_H2 | Hydrogen | All | 0–1 | 0.45 | share of aggregate loss | estimated | n/a | low | BEIS/Frazer-Nash 2022 |
| CH4_CHAIN_LOSS_TODAY | CH4 | full chain (cryogenic) | 1.6–12.0 | 1.6 | % | published (Boeing synthesis) | PUBLISHED | medium | Boeing Cascade fugitive-emissions explainer (2026-07-15, mod. 2026-07-23) |
| H2_CHAIN_LOSS_TODAY | H2 | full chain (cryogenic) | 2.0–45.7 | 12.3 | % | published (Boeing synthesis) | PUBLISHED | low-medium | Boeing Cascade fugitive-emissions explainer (2026-07-15, mod. 2026-07-23) |
| CH4_UPSTREAM_FOSSIL_CI | CH4 | extraction+processing | 4.6–4.6 | 4.6 | gCO2e/MJ | model (GREET) | PUBLISHED | medium | CASCADE docs energy/methane Table 42 (July 2026); ANL GREET 2023 |
| CH4_COMBUSTION_CI | CH4 | combustion | 55.0–55.0 | 55.0 | gCO2e/MJ | published (GREET) | PUBLISHED | high | CASCADE docs energy/methane Table 42 (July 2026); ANL GREET 2023 |
| H2_REL_FUGITIVE | Hydrogen | Delivery chain | 0.05–1.0 | 0.3 | % of chain throughput | published engineering estimate | current design | low-medium | BEIS/Frazer-Nash 2022; Cooper et al. 2022 … |
| H2_REL_VENTING | Hydrogen | Delivery chain | 0.05–1.5 | 0.3 | % of chain throughput | published engineering estimate | current design | low | BEIS/Frazer-Nash 2022; IPCC 2019 refinement (fugitive framework) |
| H2_REL_PURGING | Hydrogen | Delivery chain | 0.05–1.5 | 0.3 | % of chain throughput | published engineering estimate | current design | low | BEIS/Frazer-Nash 2022; Harrison & Peters 2013 (electrolyser purge) |
| H2_REL_BOILOFF | Hydrogen | Delivery chain | 0.24–1.2 | 0.6 | % of chain throughput | published engineering estimate | current design | medium | Fesmire et al. 2021; NASA/KSC boil-off records |
| H2_REL_TRANSFER | Hydrogen | Delivery chain | 0.0–2.0 | 0.3 | % of chain throughput | published engineering estimate | current design | low | this model §5.2; Sharafian 2019 (LNG analogue) … |
| H2_REL_ABNORMAL | Hydrogen | Delivery chain | 0.0–1.0 | 0.2 | % of chain throughput | published engineering estimate | current design | low | industry loss-of-containment frequency classes (HSE) |
| H2_ABNORMAL_FREQ | Hydrogen | Delivery chain | 0.02–0.4 | 0.08 | events/year | industry frequency statistics | current design | low-medium | HSE hydrocarbon releases database (LOC frequency classes); Fan et al. (Columbia CGEP) 2022 |
| H2_LIQ_IDEAL_WORK | Hydrogen | Storage | 3.92–3.92 | 3.92 | kWh/kg | thermodynamic derivation | demonstrated | high | Ohlig & Decker 2014 (AIP Conf. Proc. 1573); standard cryogenics texts (Barron) |
| H2_LIQ_MAGNETOCALORIC | Hydrogen | Storage | 4.5–7.0 | 5.0 | kWh/kg | prototype extrapolation | demonstrated | low | PNNL/DOE AMR liquefier programme; EU magnetocaloric refrigeration literature |
| LNG_COMPOSITION_BASIS | CH4 | combustion | 48.6–50.0 | 50.0 | MJ/kg (LHV); mass fraction | declared convention | PUBLISHED | high | GREET (pure CH4 LHV); July-2026 correspondence (LNG mixture range) |
| Gas | Lifecycle stage | Emission type | Reported range | Central model value | Unit & denominator | Measurement/estimate | Geography | Tech maturity | Source | Confidence |
|---|---|---|---|---|---|---|---|---|---|---|
| CH₄ | full supply chain | all classes | 0.19–9.4 % | 1.6 % (engine default) / 2.3 % (US class) | % of gross production, mass | measured classes | global basins | current operations | Alvarez 2018; Riddick 2019; Zhang 2020; Chen 2022, 2023; Bakkaloglu 2021 | high (classes), medium (central) |
| CH₄ | upstream floor | fugitive | ≤0.2 % | 0.2 % (trajectory floor) | % of production, mass | measured | Qatar-class certified-low | best demonstrated | Chen et al. 2023 | high |
| CH₄ | supply chain | super-emitters | 8–12 % of sector CH₄ | Pareto tail p99/p50>5 | share of emissions | measured (satellite) | global | n/a | Lauvaux et al. 2022 | high |
| CH₄ | sector context | reported-vs-measured gap | ≈+80 % | context only | Mt/yr | measured synthesis | global | n/a | IEA Global Methane Tracker 2025 | high |
| H₂ | delivery chain | vapour/fugitive | 0–20 % (bounds) | 2 % (engine default) | % of chain mass | published engineering estimate | generic | current design | van Ruijven 2011 basis; Boeing bounds page | medium |
| H₂ | production | fugitive/purge | ≈0.5 % class | floor 0.5 % (trajectory) | % mass | engineering assessment | UK 2050 scenario | assessed | BEIS/Frazer-Nash 2022 | low-medium |
| H₂ | storage | boil-off | 0.048–0.1 %/day | chain model rates | %/day of stored mass | measured | large stationary spheres | demonstrated | Fesmire et al. 2021 | high |
| H₂ | transfer/chill/purge | historical aggregate generated loss | 72.44 kg/day @1 t/day | bracket 15.40×–≈1.11× | kg/day; fate declared unknown | modelled, fate unmeasured | generic airport chain | none (L1 gap) | this model §5.2 | low |
| CH₄ | atmosphere | GWP | 29.8/80.0 (82.5 fossil variant) | 29.8/80.0 | kgCO₂e/kg, GWP100/20 | published | global | n/a | IPCC AR6 2021 | high |
| H₂ | atmosphere | indirect GWP | 8.0–12.8 (100-yr) | 11.6±2.8 / 37.3±15.1 | kgCO₂e/kg, GWP100/20 | published ensemble | global | n/a | Sand 2023; Warwick 2023; Ocko & Hamburg 2022; Bertagni 2022; Yang 2025 | medium |
| both | improvement | roadmap CAGRs | CH₄ 2/6/12, H₂ 1/4/8 %/yr | preset trajectories | annual reduction of loss rate | TARGET (roadmaps) | global programmes | announced targets | OGMP 2.0/IEA class (CH₄); recovery-technology roadmaps (H₂) | low (targets) |
Additional §11 references (Harvard style, added to §10 on revision): IEA (2025) Global Methane Tracker 2025; UNEP IMEO / OGMP 2.0 reporting framework; BEIS/Frazer-Nash Consultancy (2022) Fugitive Hydrogen Emissions in a Future Hydrogen Economy; US DOE Hydrogen Emissions and Environmental Impacts workshop; Ocko, I.B. and Hamburg, S.P. (2022) 'Climate consequences of hydrogen emissions', Atmos. Chem. Phys. 22; Bertagni, M.B. et al. (2022) 'Risk of the hydrogen economy for atmospheric methane', Nat. Commun. 13; Oxford Institute for Energy Studies hydrogen-leakage review. [metadata completion pending — non-headline supporting; tracked in Appendix B: pages/DOIs for the §11 additions.]
Appendix D — Model Verification and Validation (DL-085, added 2026-07-24)
D.1 Verification tests (does the code solve the equations right?)
809 automated tests gate every build. Classes: frozen-parity pins (CASCADE V2.7/V3.0 constants, numerically identical outputs; reference-value verifications), mass-balance identities (CH₄ CI reconstructs (CI_prod−liq)/(1−f)+f·CI_loss+liq to 8 dp), evidence-register structure + automated consistency checks + duplication scans (no re-declared constants), trajectory floors/monotonicity, LHS stratification (one sample per stratum), tornado ranking on analytic functions, provenance stamping. CI fails on any drift between documentation, register and code (§DL-083 architecture).
D.2 Equation documentation and dimensional audit (§8)
Every CI equation is g CO₂e/MJ (LHV denominator, declared per pathway). Verified: CH₄ fossil/bio/PtG forms carry replacement via 1/(1−f) (unlike CASCADE's fossil eq 165 — divergence declared); H₂ delivered form matches CASCADE eq 148 structure incl. boil-off recovery; loss CI = GWP×1000/LHV (558↔27.9, 596↔29.8 both carried); GWP20/GWP100 never mixed in one output (V5-DL-073 guard); energy balance: chain efficiencies multiply η₀ by Mach class (0.33/0.36), validated against H2Avia log-Breguet closures (−0.3/−3.0/+7.9 %). Carbon accounting: biogenic CO₂ neutral, fossil CH₄ oxidation included via fossil-GWP choice on the independent track.
D.3 Validation evidence (does the model match the world?)
External closures: H2Avia triple closure (three aircraft, ≤8 %); Cirium real-day DES calibration (OTP15 0.931 vs measured 0.9389); FlyZero FZN geometry closed in OpenVSP with measured-datum cross-section (8.81=8.81 m exact) and solved S&C (SM 12–15 %, V_h 0.99, V_v 0.062); VSPAERO Tier-2 polar (semi-empirical cruise L/D 15.6, inside the FZN Tier-1 band); FlowLab LBM validated on Poiseuille (0.23 %), Ghia Re=100 cavity (0.042), cylinder-drag sign. CASCADE cross-checks: our A7 45.7 % bound and F1 GWP analysis both confirmed by Boeing's July 2026 publications (§12).
D.4 Benchmark feature matrix (§DL-085.5, condensed)
| Capability | CASCADE | LTAG/D2050/Waypoint | ReFuelEU | GREET/Argonne | JEC WtW | UK BEIS H₂ | IEA | HyFlux |
|---|---|---|---|---|---|---|---|---|
| Fleet/traffic transition | ● | ● | ◐ | — | — | — | ◐ | — (excluded) |
| Per-MJ WtWa fuel LCA | ◐ | ◐ | ◐ | ● | ● | ◐ | ◐ | ● |
| CH₄ pathway detail | ● (2026) | — | — | ● | ◐ | — | ◐ | ● |
| H₂ released (all classes) | ◐ (cryo only) | — | — | ◐ | ◐ | ● (fugitive) | ◐ | ● |
| Year-resolved leakage trajectories | — | — | — | — | — | — | — | ● (innovation) |
| Evidence register + automated consistency checks | — | — | — | — | — | — | — | ● (innovation) |
| Quantified uncertainty (MC/LHS/tornado) | — (bounds only) | ◐ | — | ◐ | ◐ | ● | ◐ | ● |
| Cryogenic/superconducting systems | — | — | — | — | — | — | — | ● (innovation) |
| Aircraft geometry closure (CAD/aero) | — | — | — | — | — | — | — | ● (innovation) |
| Airport ops DES (measured calibration) | — | — | — | — | — | — | — | ● (innovation) |
| Cost/MACC | ● | ◐ | — | — | — | ◐ | ● | ◐ (roadmap) |
● full · ◐ partial · — absent. Missing in HyFlux: fleet transition (intentional), whole-system cost (roadmap §DL-084.6), ammonia/GH₂ pathways (planned).
D.5 Assumptions, limitations, known uncertainties, future work
Assumptions: register v1.5.1 is the complete assumption set — every entry carries source, year, geography, measurement basis, evidence type (8-type controlled vocabulary), confidence, TRL, applicability and review status. Limitations: no measured airport LH₂ chain exists (all H₂ chain values are class estimates or targets); transfer/chill/purge fate unmeasured (§5.2 UNKNOWN); technology-measure adoption ramps are scenario constructs even where the measure itself is measured; economics exclude aircraft financing; infrastructure costs simplified. Known uncertainties: H₂ atmospheric chemistry (GWP100 8.0–12.8 ensemble spread); CH₄ regional leakage 0.19–9.4 %; non-CO₂ effects at short horizons. Future work: DL-084 roadmap (§11 of the technical review) — cost module, ammonia/GH₂, feedstock-constrained comparison, external peer review.
D.6 Reproducibility (§7)
Every export stamps: model hyflux-lca-v5, engine 5.0.0-dl085, evidence
register version, paper version, generation timestamp (provenanceStamp()).
Deterministic seeds for MC/LHS. Register + code + paper regenerate from one
source; drift fails CI. Independent reviewers can rebuild every table in this
paper from the repository at the stamped versions.
Appendix E — Mechanism Ledger (complete, generated)
Generated from data/governance/ledger-reconstruction.json (independent Python
reconstruction, 10-dp agreement with the engine). Central fate case, base year,
1,000 kg/day delivered; kg/day. Fate cases: lower 1–central
11.1–upper ≈15 kg/day atmospheric
(upper converts unresolved to vented and degrades recovery).
| Mechanism | Generated | Recovered | Returned/used | Atmosphere | Unresolved |
|---|---|---|---|---|---|
| fugitive | 3.0 | 0.0 | 0.0 | 3.0 | 0.0 |
| venting | 3.0 | 0.9 | 0.0 | 2.1 | 0.0 |
| purging | 3.0 | 0.6 | 0.0 | 2.4 | 0.0 |
| boiloff | 6.0 | 1.2 | 3.6 | 1.2 | 0.0 |
| transfer | 3.0 | 0.4 | 0.8 | 0.4 | 1.5 |
| abnormal | 2.0 | 0.0 | 0.0 | 2.0 | 0.0 |
| total | 20.0 | 3.1 | 4.3 | 11.1 | 1.5 |
Replacement production: 12.7 kg/day (out-of-boundary mass only).
Stage-level transfer decomposition: data/evidence/transfer-stage-table.json (sums to the
historical 72.44 aggregate). Internal decision-log identifiers, correction-series detail and
claims-register IDs live in this and the following appendices only.
Appendix F — Data, code and claims governance (internal)
All results derive from the repository's additive v5 module and regenerate deterministically from seed-pinned code (figures and tables via docs/publications/figure-data/). The code base is maintained privately; no claim of public code availability is made. Public claims are governed by docs/public-claims-register-v5.csv (pathway, functional unit, boundary, horizon, scenario, evidence status, uncertainty, validation test, decision record, caveat, channel and status per claim), enforced by tests/public-claims-consistency.spec.ts, which recomputes register values from the modules, bans verdict vocabulary and guards against the withdrawn crossover figure. Decision records: docs/decision-log-v5.md (V5-DL-050…076) and the platform engineering decision log. Data requests should cite register claim IDs.
Appendix A — Correction and Methodological Revision History
DL-090 methodological revision (2026-07-24). This revision reflects improved accounting resolution and does not result from a new physical measurement.
| Item | Legacy representation | Mechanism representation | Reason |
|---|---|---|---|
| Atmospheric release | 20.0 kg/day | 11.1 kg/day | mechanism-specific recovery |
| Unresolved fate | aggregate treatment | 1.5 kg/day | explicit fate ledger |
| Replacement production | aggregate basis (20.4) | 12.7 kg/day | no replacement for recovered hydrogen |
Appendix A.1 — Correction history (DL-061 C1–C7 and V5-DL-073), full before/after
Quoted values below are correction records, not current claims (current claims live in the register). Full detail: docs/correction-impact-summary-dl061.md.
| ID | Neutral description | Before → after (central scenario) |
|---|---|---|
| C1 (MAJOR) | Transfer/chill/purge losses (72.44 kg/day) had no atmospheric fate; venting headline silently boil-off-subset-only | default unchanged (8.6223/0.5598 kg/day, 15.40×) with the gap declared; fate='vented': 81.06/73.33 kg/day, ratio ≈1.11× |
| C2 | Published boil-off Sobol 0.010 matched no computable quantity | 0.010 → 0.003 (grouped alternative 0.007, labelled) |
| C3 | Three CH₄ GWP20 bases undocumented | v5 keeps 80.0 (AR6 class); 82.5 site divergence declared |
| C4 | Ground-hold/mission venting charged twice | well-to-airport warming 100.019 → 84.456 kg CO₂e100/day (−15.56 %); mission 322.502 → 320.984 kg |
| C5 | Fossil-leak oxidation adder atop AR6-inclusive GWP | adder → 0; modules reconcile to 9 dp |
| C6a | per-MJ label on per-50-MJ values | fossil 9.574 → 0.18822; bio 2.522 → 0.05044; e 4.744 → 0.09488 kg CO₂e/MJ shaft |
| C6b | Replacement charged for re-liquefied mass | produced = T/(1 − b·(1 − reliq_eff)); at reliq_eff 0.5: 52.63 → 25.64 kg |
| C6c | GWP100 rows inside CO₂e20 output | LCH₄ CO₂e20 1068.51 → 1135.92; LH₂ 344.11 → 342.59 kg |
| C6d | "identical propulsion" overstatement | statement corrected; η 0.465/0.45 declared per-fuel |
| C7 | Decision-log series collision | v5 renumbered V5-DL-050…075 |
| V5-DL-073 | Engine-slip row at GWP100 inside CO₂e20 (the C6c residual) | LCH₄ CO₂e20 1135.925 → 1283.515 kg/mission (+147.590); CO₂e100 unchanged 674.413 |
Withdrawn value (correction-history context only): the pre-R2 crossover figure of roughly twenty-five grams CO₂e per kilowatt-hour (2.3 % leakage) is withdrawn (register CR-V5-015); recomputation places the band at ≈175–200 g/kWh (CR-V5-014), and a guard test fails any current publication document in which the withdrawn figure reappears.
Appendix B — Reference quality-control table
Machine-readable version: docs/publications/v3-reference-audit.csv.
| Citation key | Claim supported | Source file | Metadata complete? | Primary source? | Verification action |
|---|---|---|---|---|---|
| Alvarez et al. (2018) | US-average supply leakage 2.3 % | registers.ts R-TD-US |
Yes (361:186) | Yes | none |
| Riddick et al. (2019) | UK offshore 0.19 % | leakage evidence classes | Partial | Yes | verify pages/DOI |
| Zhang et al. (2020) | Permian 3.7 % (satellite) | registers.ts R-TD-PERMIAN-SAT |
Partial | Yes | verify eLocator/DOI |
| Chen et al. (2022) | Permian 9.4 % (aerial) | registers.ts R-TD-PERMIAN-AIR |
Partial | Yes | verify pages/DOI |
| Chen et al. (2023) | Qatar-class ≤0.2 % | registers.ts R-TD-QATAR |
Partial | Yes | verify title/pages/DOI |
| Bakkaloglu et al. (2021/2022) | UK biomethane 3.7 % | registers.ts R-TD-UK-AD |
Partial | Yes | verify both records |
| Lauvaux et al. (2022) | ultra-emitters 8–12 % | registers.ts R-ULTRA-EMITTERS |
Partial | Yes | verify pages/DOI |
| Sand et al. (2023) | H₂ GWP 11.6 ± 2.8 / 37.3 ± 15.1 | hydrogen-climate-effects.ts |
Partial (locator conflict 4:134 vs 4:203) | Yes | resolve against publisher record (RN-5) |
| Warwick et al. (2023) | H₂ GWP 12 ± 6 | hydrogen-climate-effects.ts |
Partial | Yes | verify end page/DOI |
| Hauglustaine et al. (2022) | H₂ GWP 12.8 ± 5.2 | hydrogen-climate-effects.ts |
Partial | Yes | verify article number/DOI |
| Derwent (2023) | H₂ GWP 8 ± 2 | hydrogen-climate-effects.ts |
No | Yes | obtain full record |
| Yang et al. (2025) | OH-bias ≈−20 % direction | Fugitive-Emissions-Verification.md |
Yes (DOI) | Yes | confirm title at DOI |
| ACP 25:4929 (2025) | leakage size/location sensitivity | Fugitive-Emissions-Verification.md |
No (authors unknown) | Yes | obtain authors/DOI |
| Fesmire et al. (2021) | storage boil-off 0.048–0.1 %/day | registers.ts R-BOIL-SPHERE |
Yes (NTRS id) | Yes | confirm exact title |
| Notardonato et al. (2017/18) | ZBO 390 W at 20 K | registers.ts R-ZBO-COOLER |
Yes (NTRS ids) | Yes | confirm exact titles |
| Al Ghafri et al. (2022) | liquefaction 12–14 kWh/kg (Boeing's bounds source) | parity note A4 | Partial | Yes | verify volume/pages/DOI |
| van Ruijven et al. (2011) | 20 % vapour-loss upper; 2 % expected | bounds-page extraction | Partial (21:983–994) | Yes | verify title/DOI |
| IPCC (2021) | CH₄ GWP 29.8 / 80.0-class | registers.ts R-CH4-GWP100/20 |
Report-level | Yes | add chapter/table pin-cite |
| European Commission (2026) | 82.5 basis divergence context | DL-061 C3 note | Web (access-dated) | Secondary | re-verify on access |
| Boeing (2026a) | CASCADE equations/bounds | parity reconstruction | Web (access-dated) | Primary for CASCADE | mutable; access-dated |
| Boeing (2026b) | communications-layer findings | parity note A5–A7 | Web (access-dated) | Primary for CASCADE comms | mutable; access-dated |
Register: docs/public-claims-register-v5.csv · corrections archive: docs/correction-impact-summary-dl061.md · decision records: docs/decision-log-v5.md (V5-DL-050…075), platform engineering decision log (DL-060…063).